Grid simulation :presence absence GoM
Kushal K Dey
12/5/2017
We design a grid of presence and absence values and then test the binClust model on the corresponding data to check if the estimated clusters conform with the expected blocks in the grid.
library(methClust)We try to build a block matrix that mimics a presence-absence structure of bird species along the two sides of the Wallace line. We assume that the first 500 locations fall in region A and there are 100 bird species in this region - hence they are present in all of these 500 locations. We also assume that there are 300 locations in region B, which has its own set of species that are present in each of these 300 locations. Apart from that, there are some species that are present in region A as well as region C, which is in the middle of regions A and B, and then some species that are present in region C and region B but not in A.
block <- matrix(0, 1000, 300)
block[1:500, 1:100] <- matrix(1, 500, 100)
block[1:700, 101:150] <- matrix(1, 700, 50)
block[501:1000, 151:200] <- matrix(1, 500, 50)
block[701:1000, 201:300] <- matrix(1, 300, 100)
topics <- meth_topics(block, 1- block,
K=2, tol = 1, use_squarem = FALSE, NUM_INDICES_START = 150)##
## Estimating on a 1000 samples collection.
## log posterior increase: 3888.1, done.K <- 2
barplot(t(topics$omega),
col = 2:(K+1),
axisnames = F, space = 0,
border = NA,
main=paste("No. of clusters=", K),
las=1, ylim = c(0,1), cex.axis=1.5,cex.main=1.4)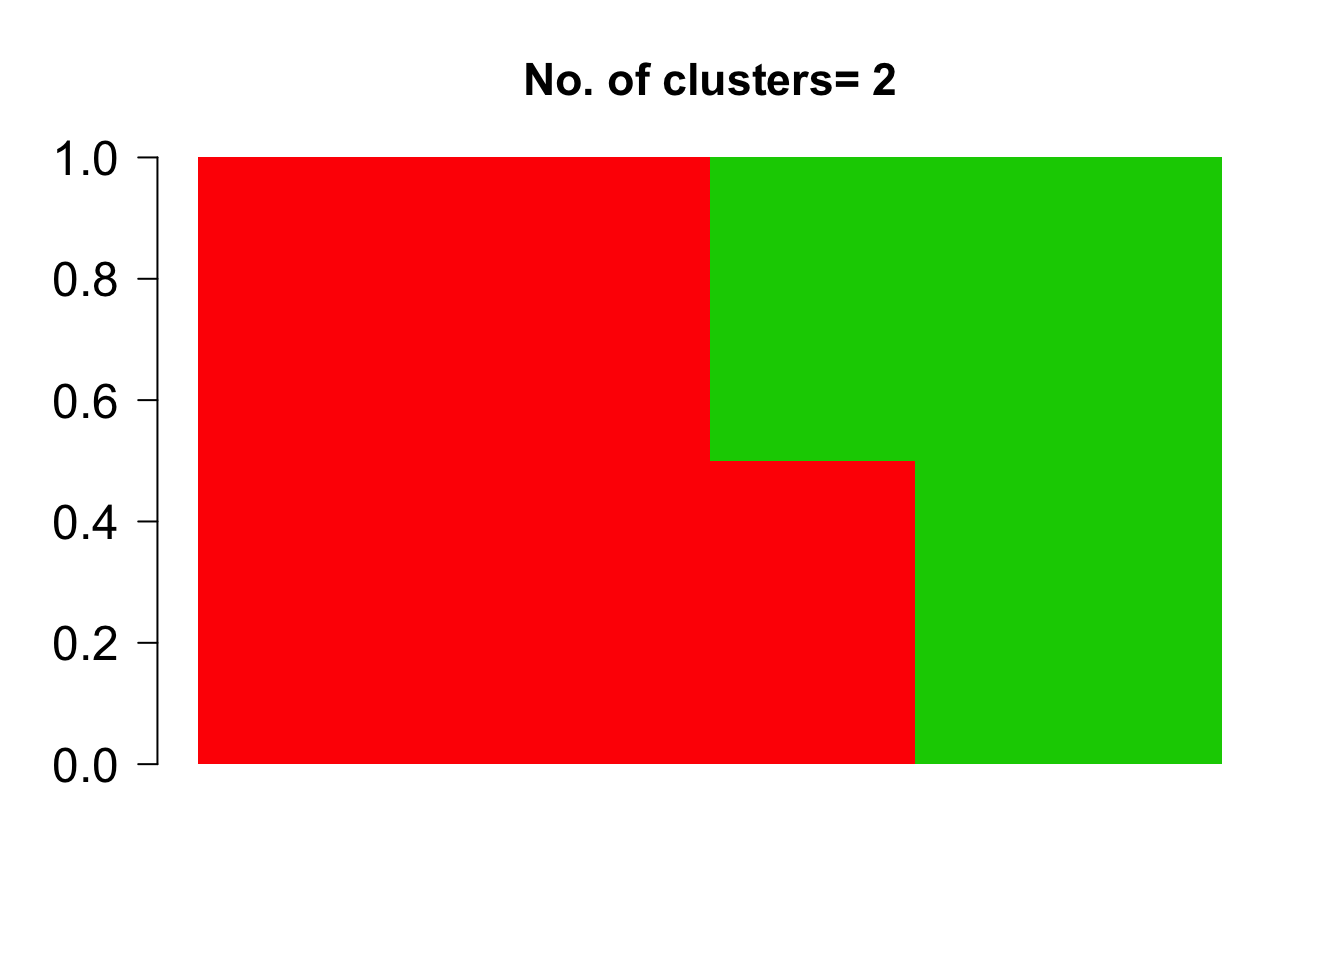
plot(topics$freq[,1])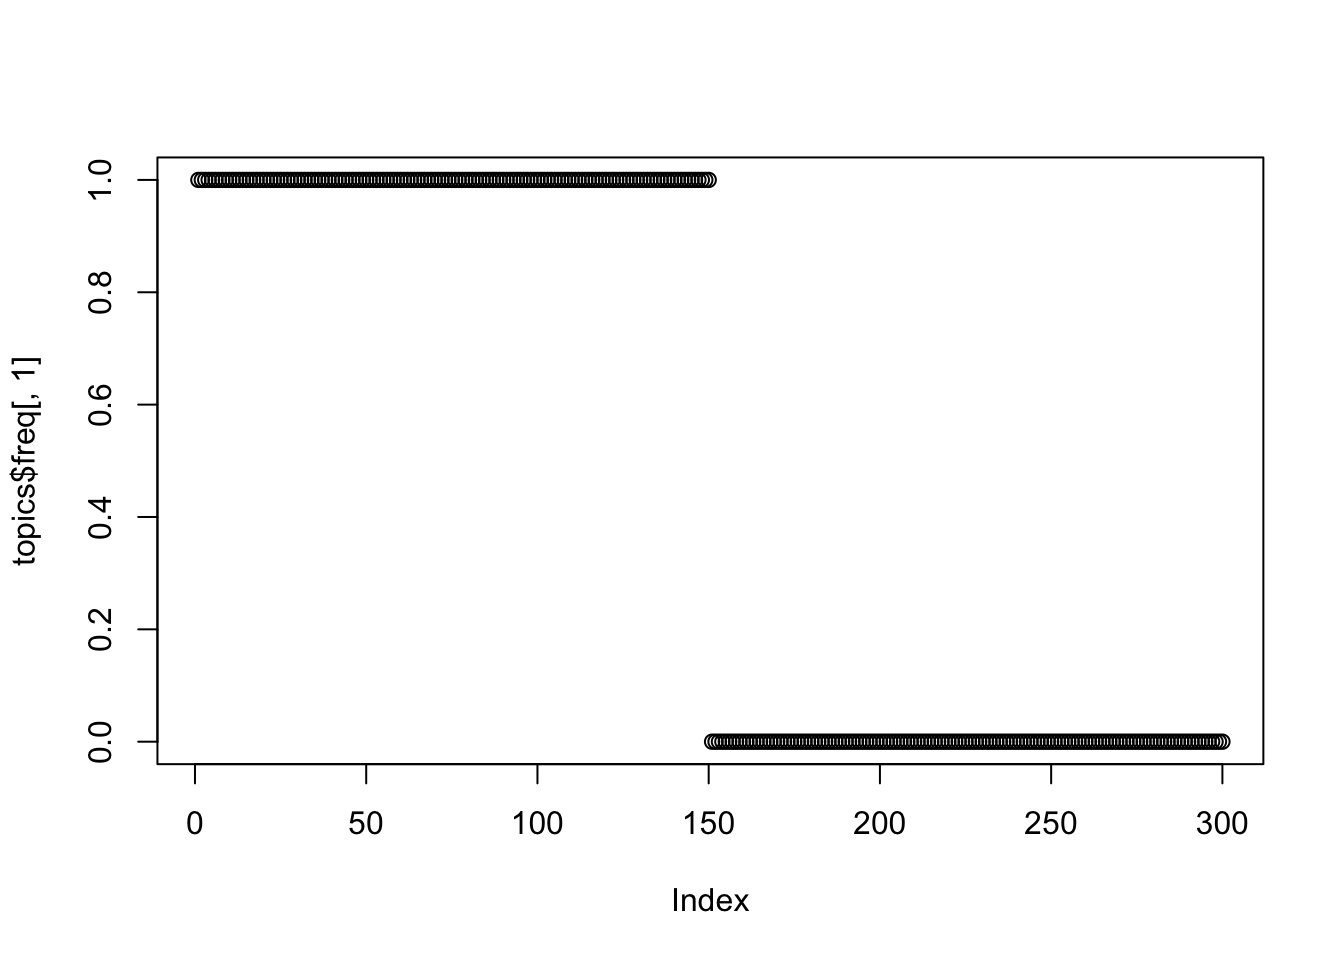
plot(topics$freq[,2])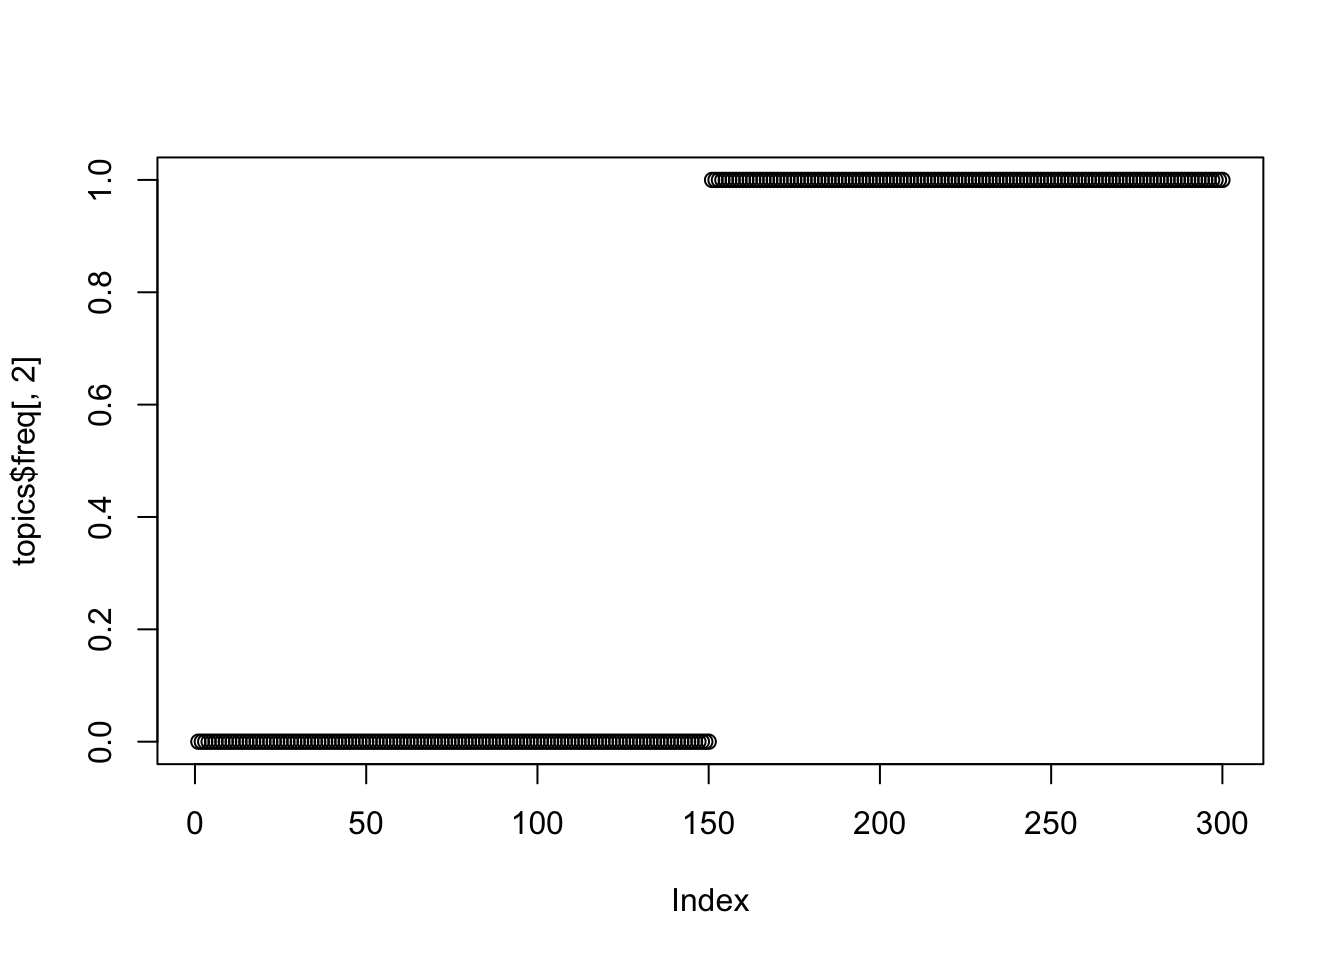
This R Markdown site was created with workflowr