methclust global assemblages part 2
Kushal K Dey
1/24/2018
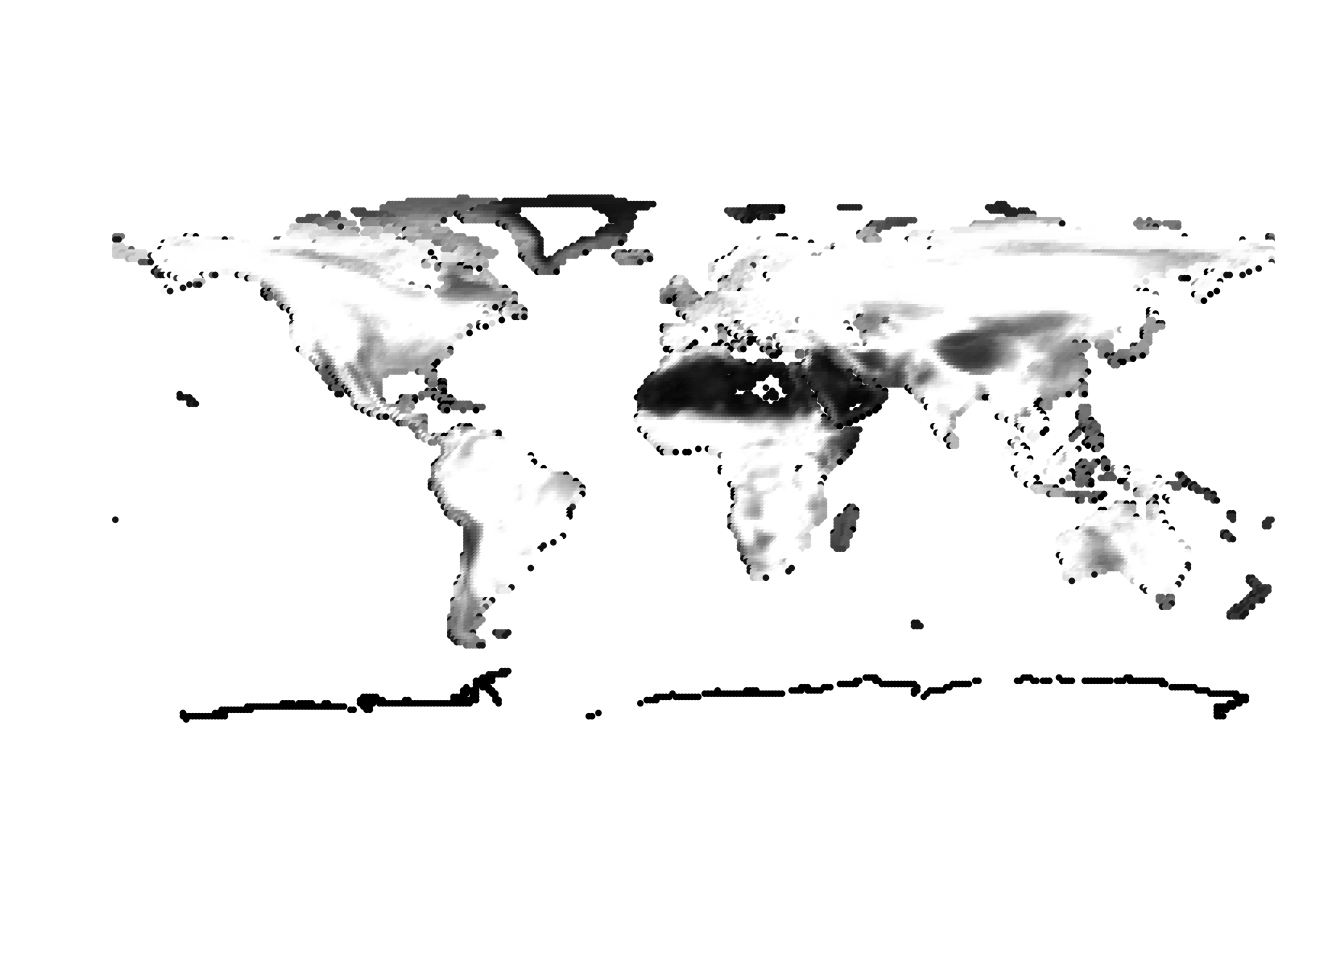
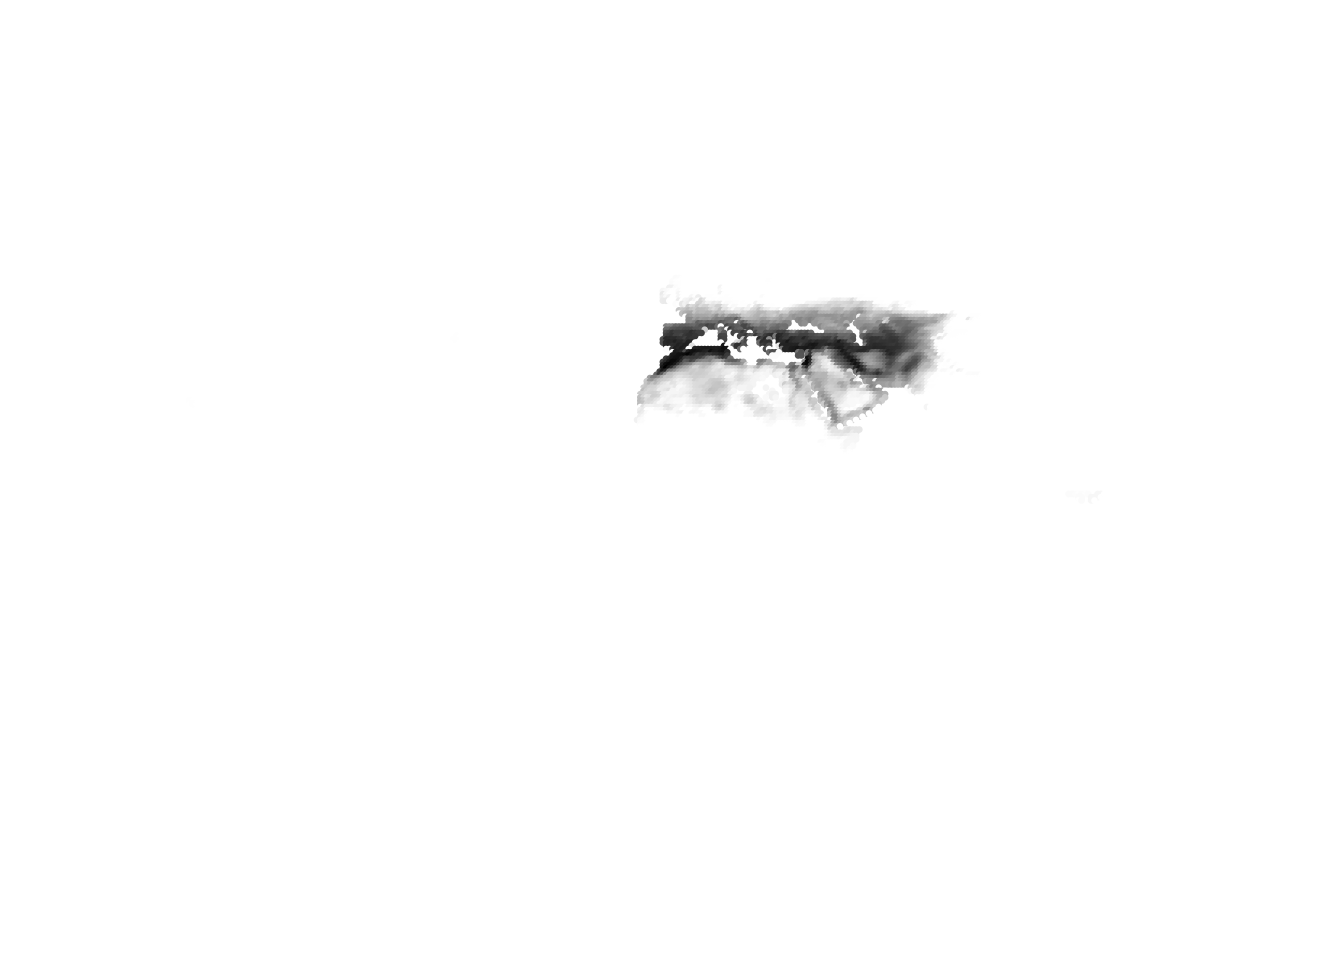
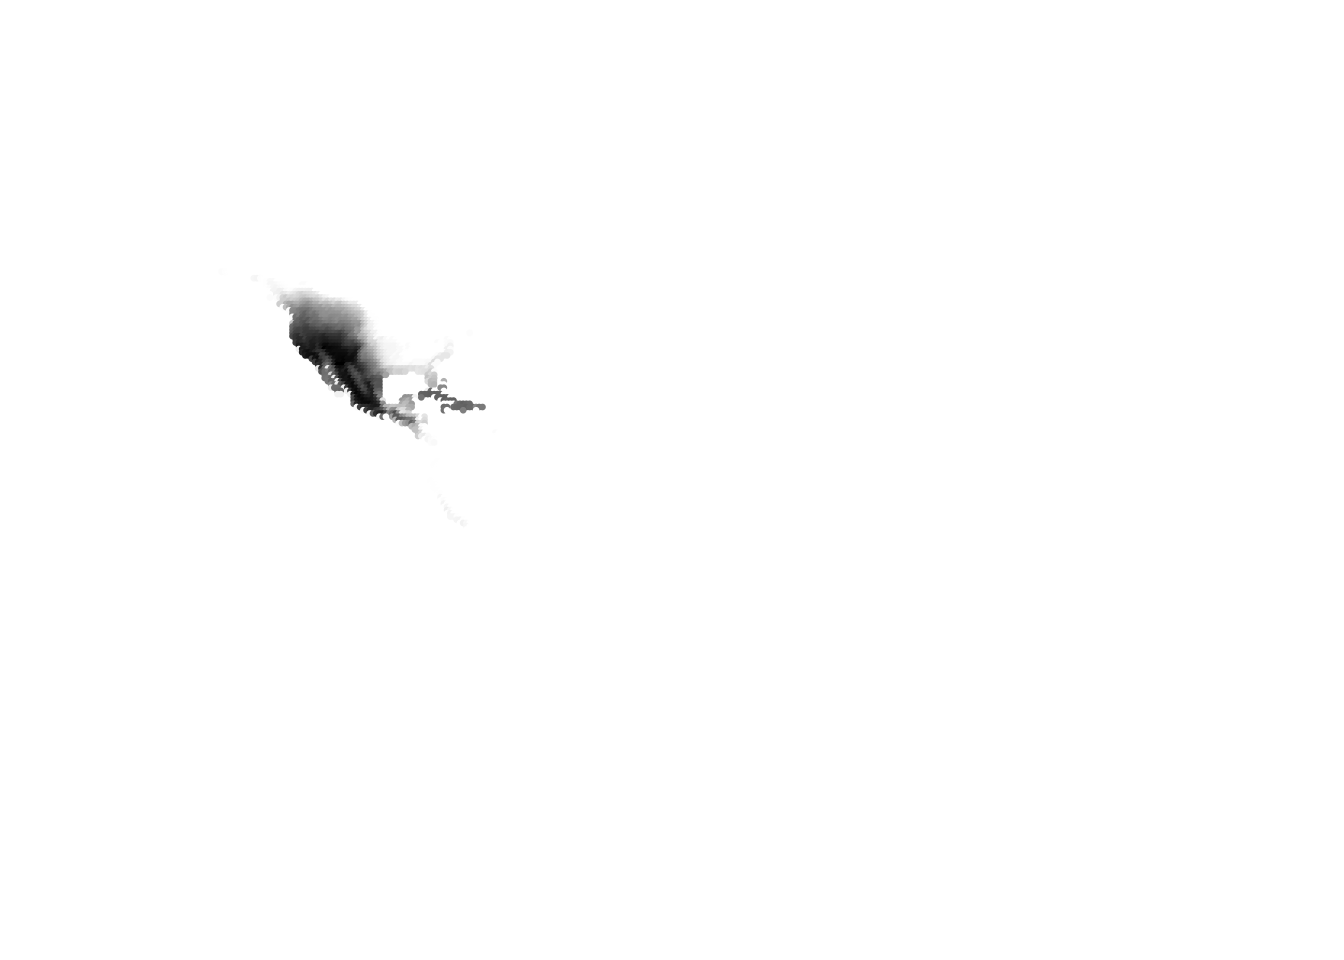
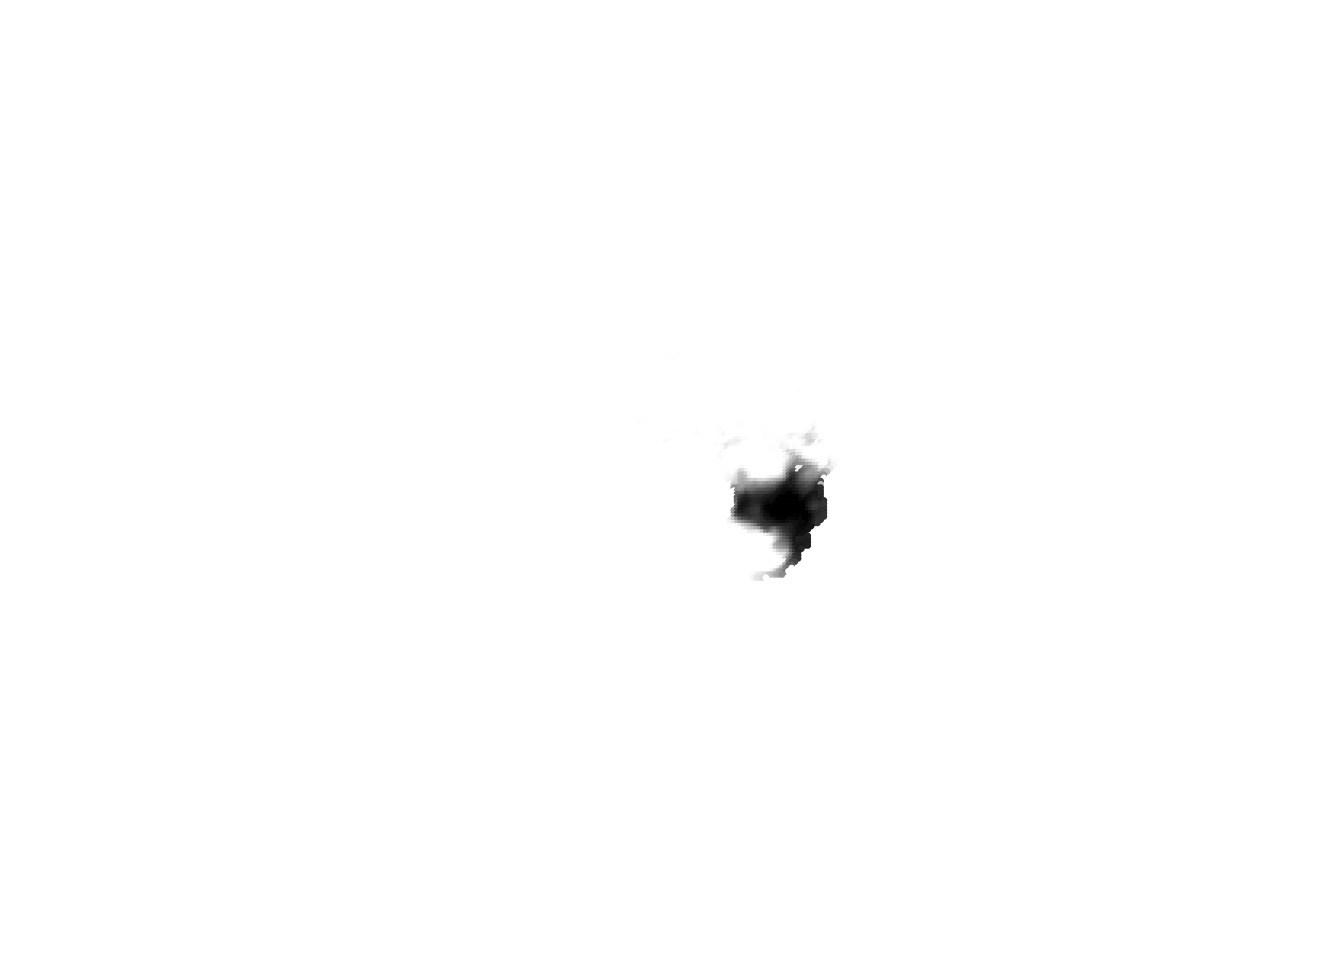
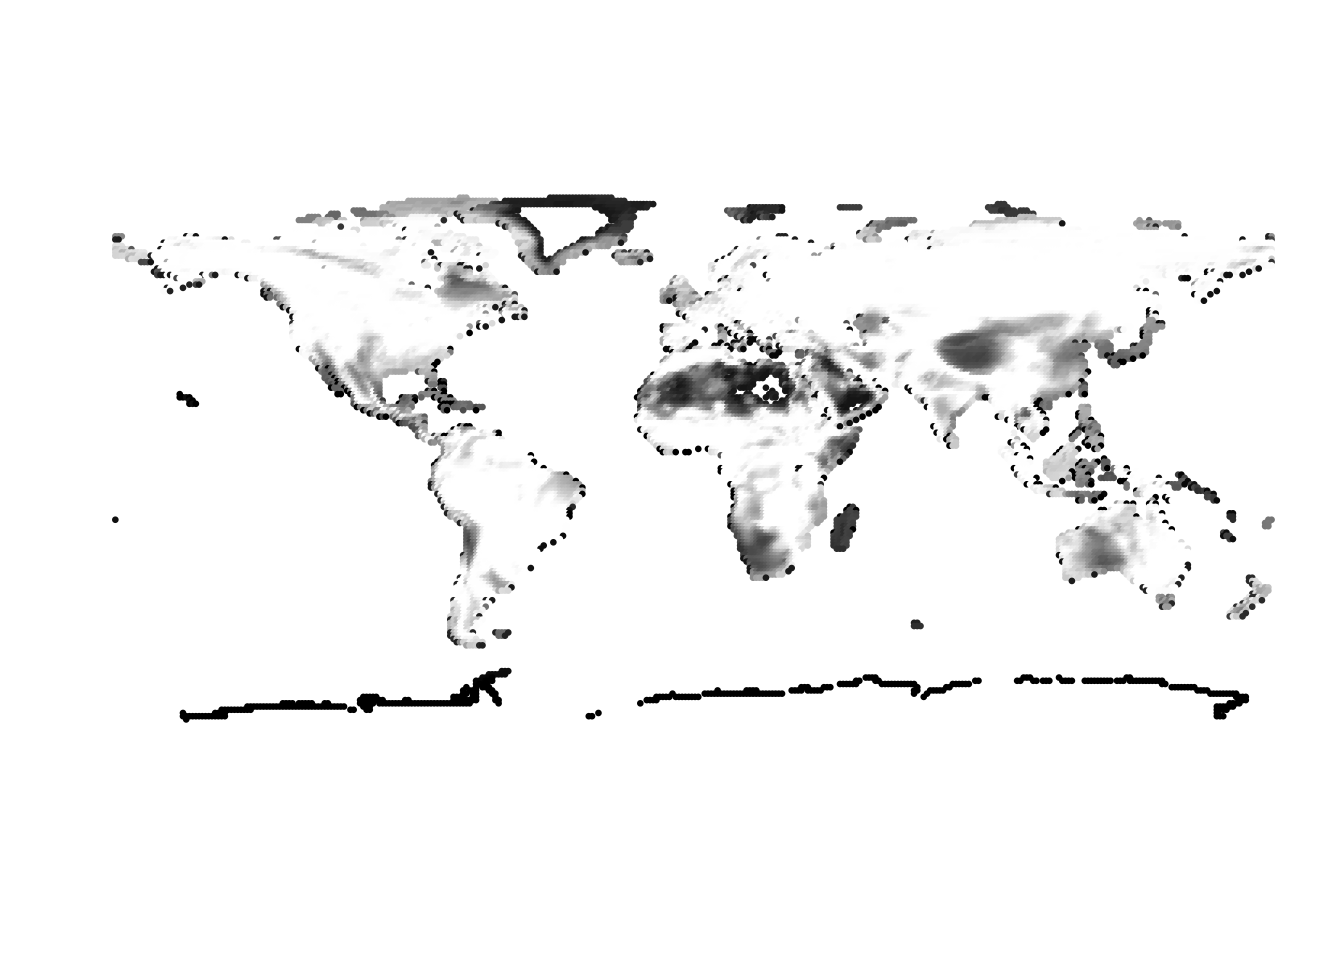
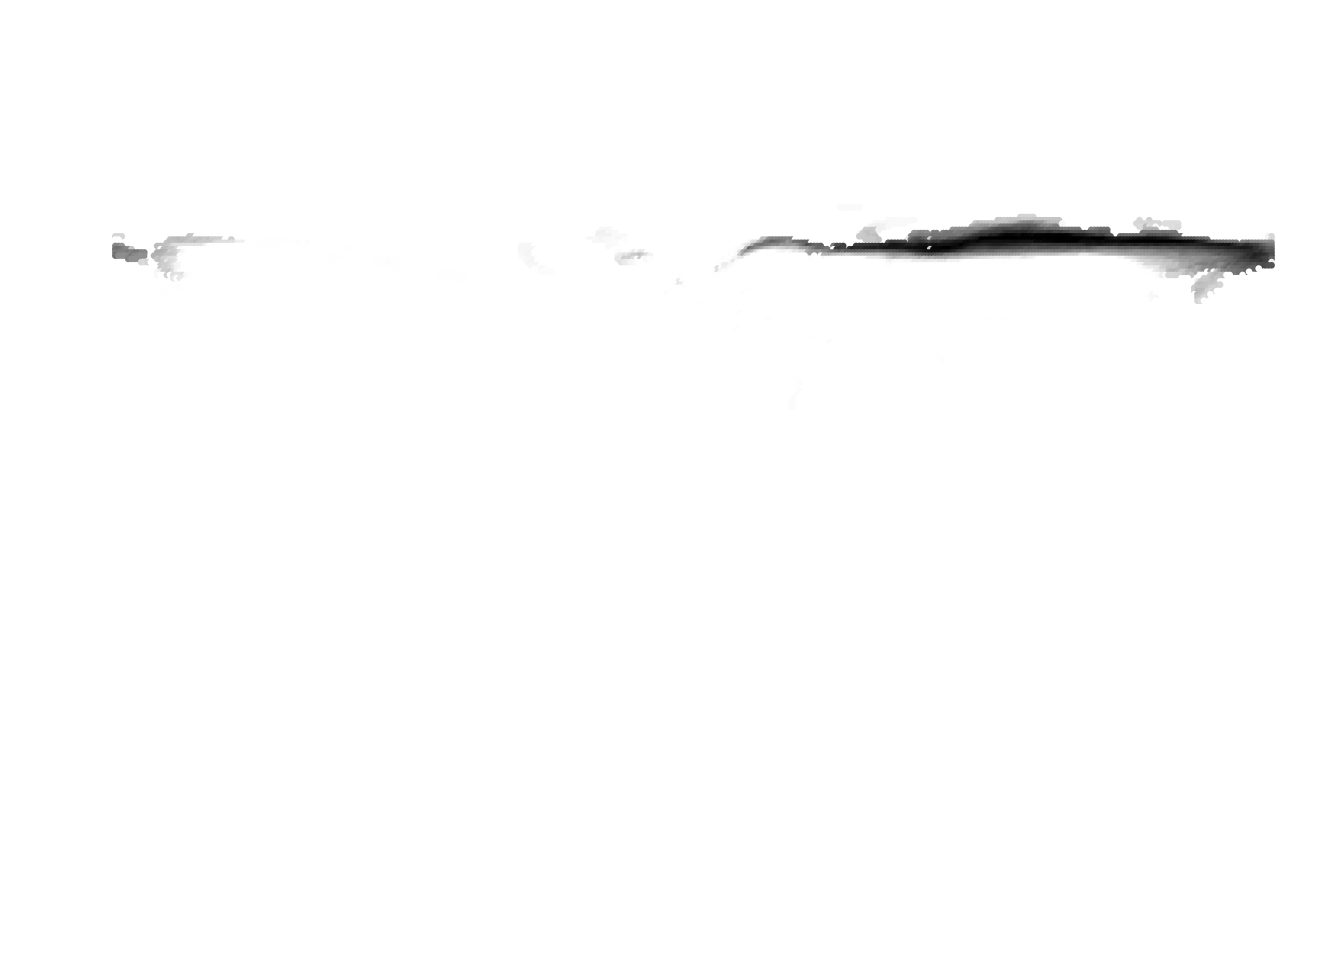
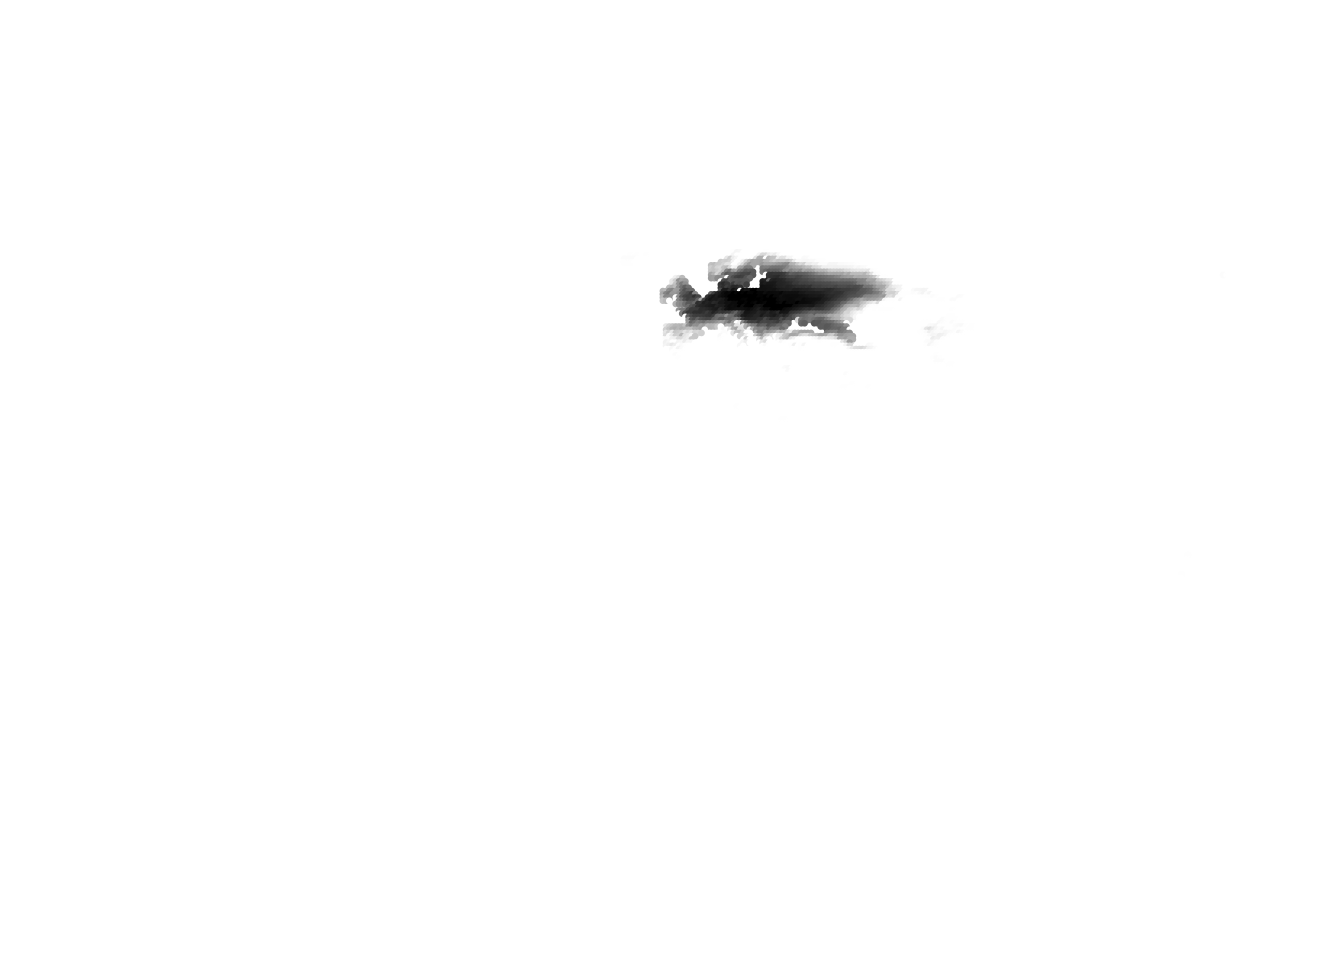
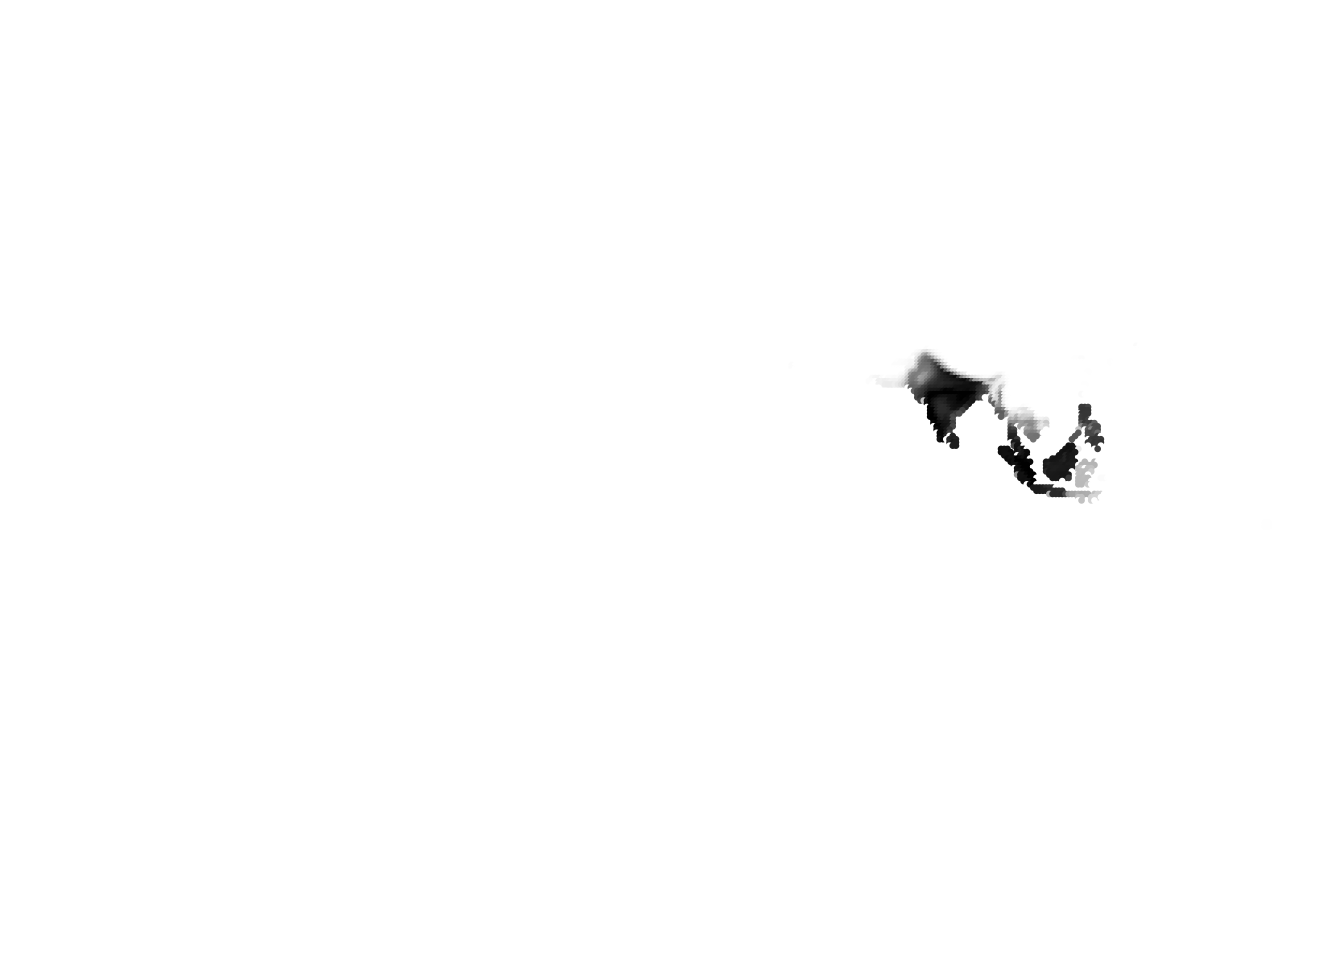
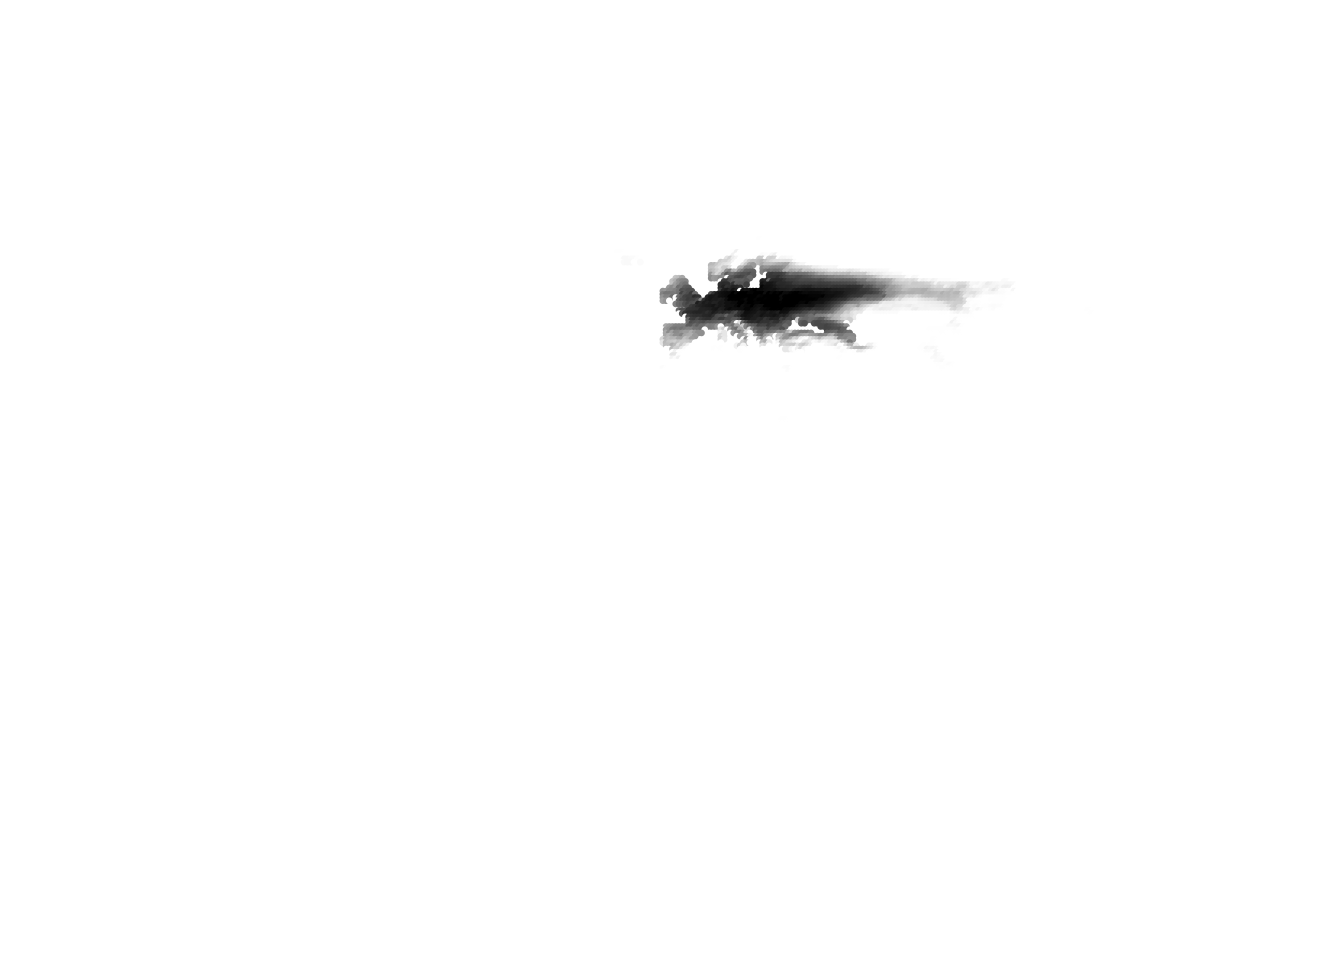
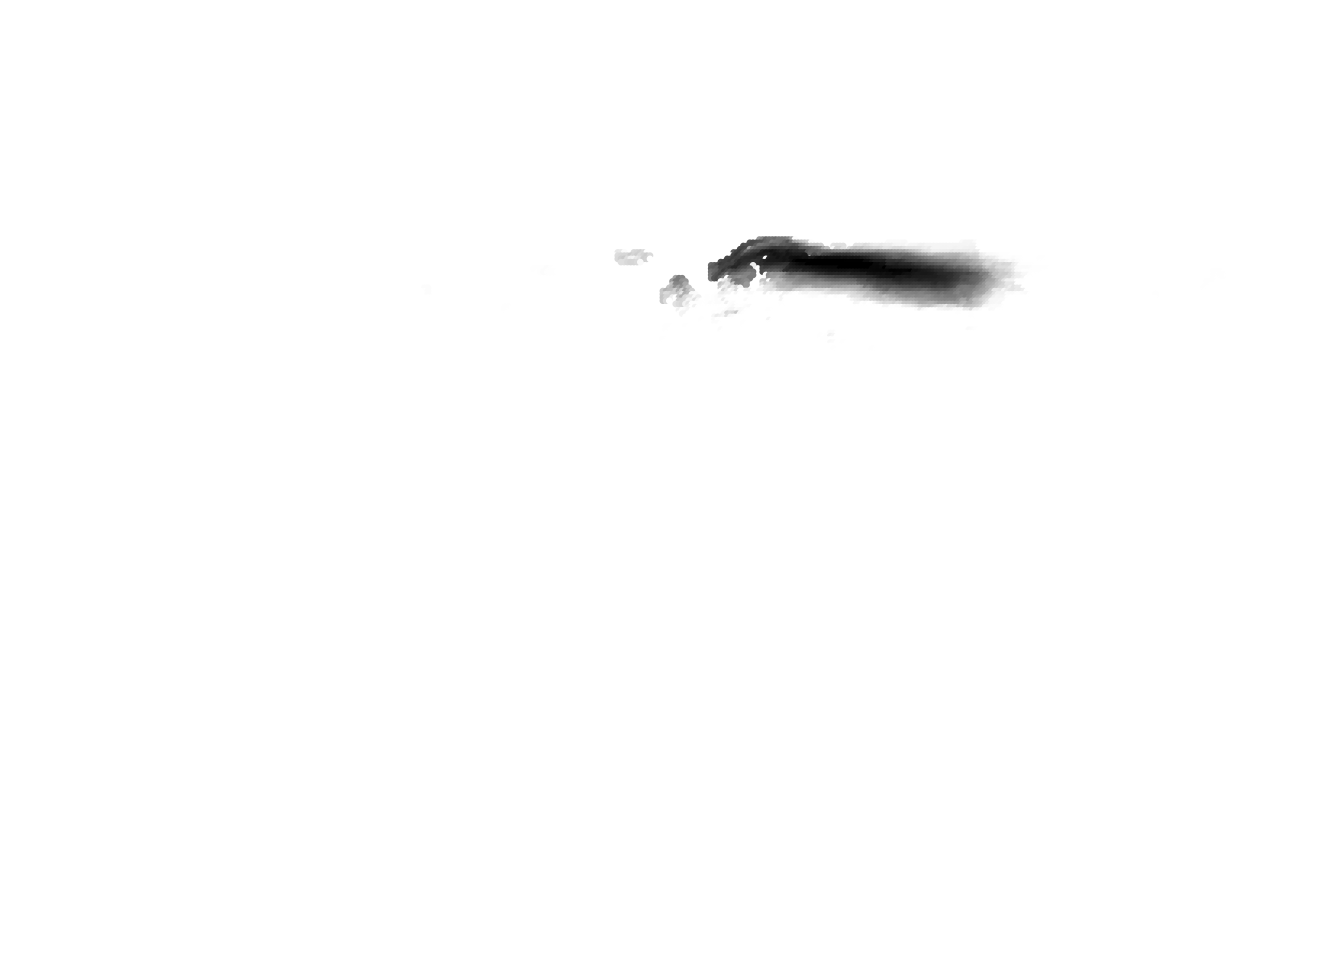
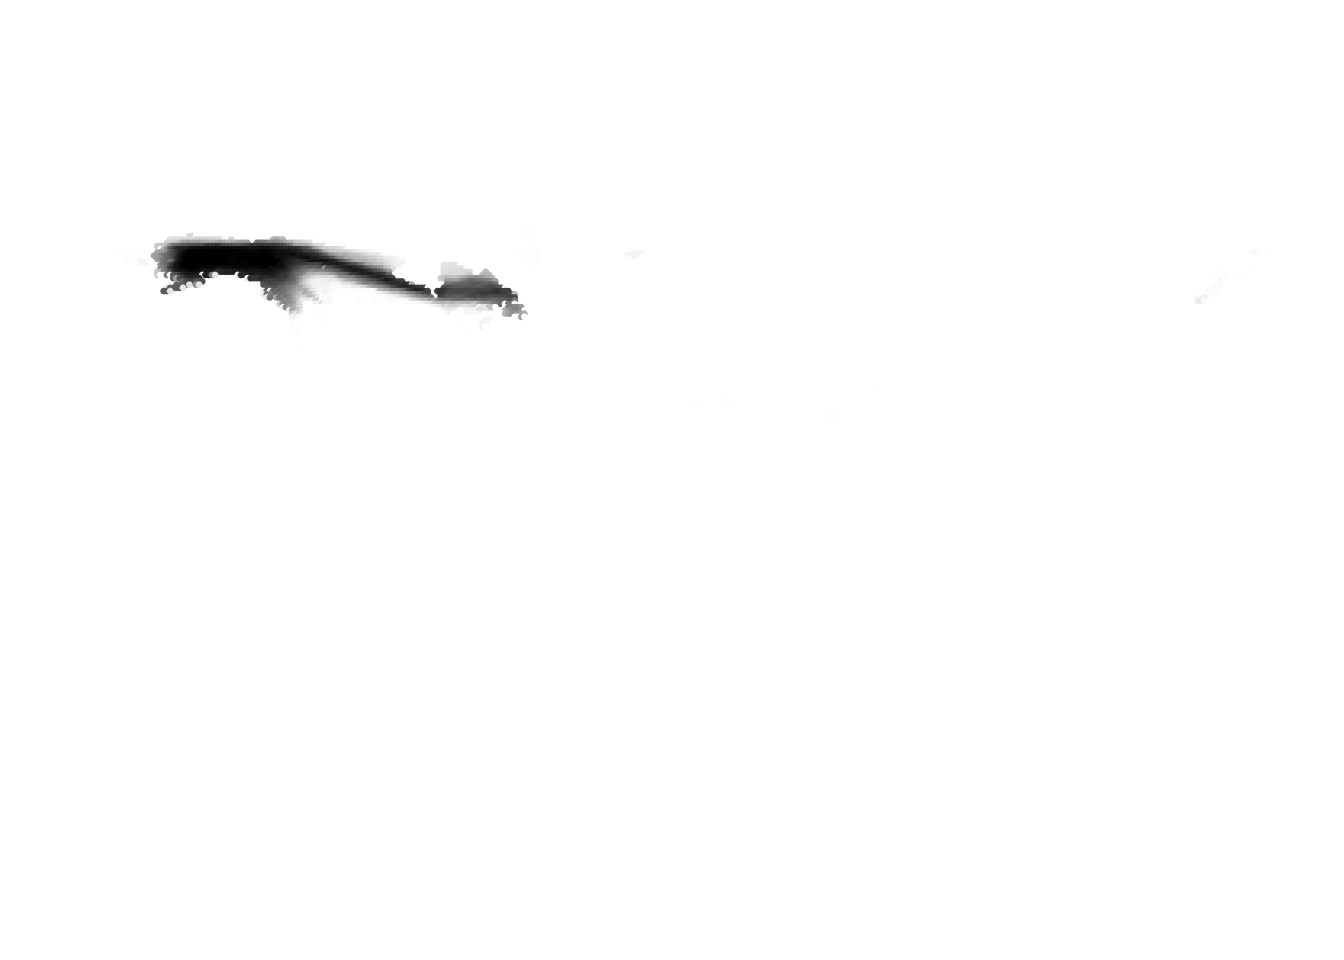
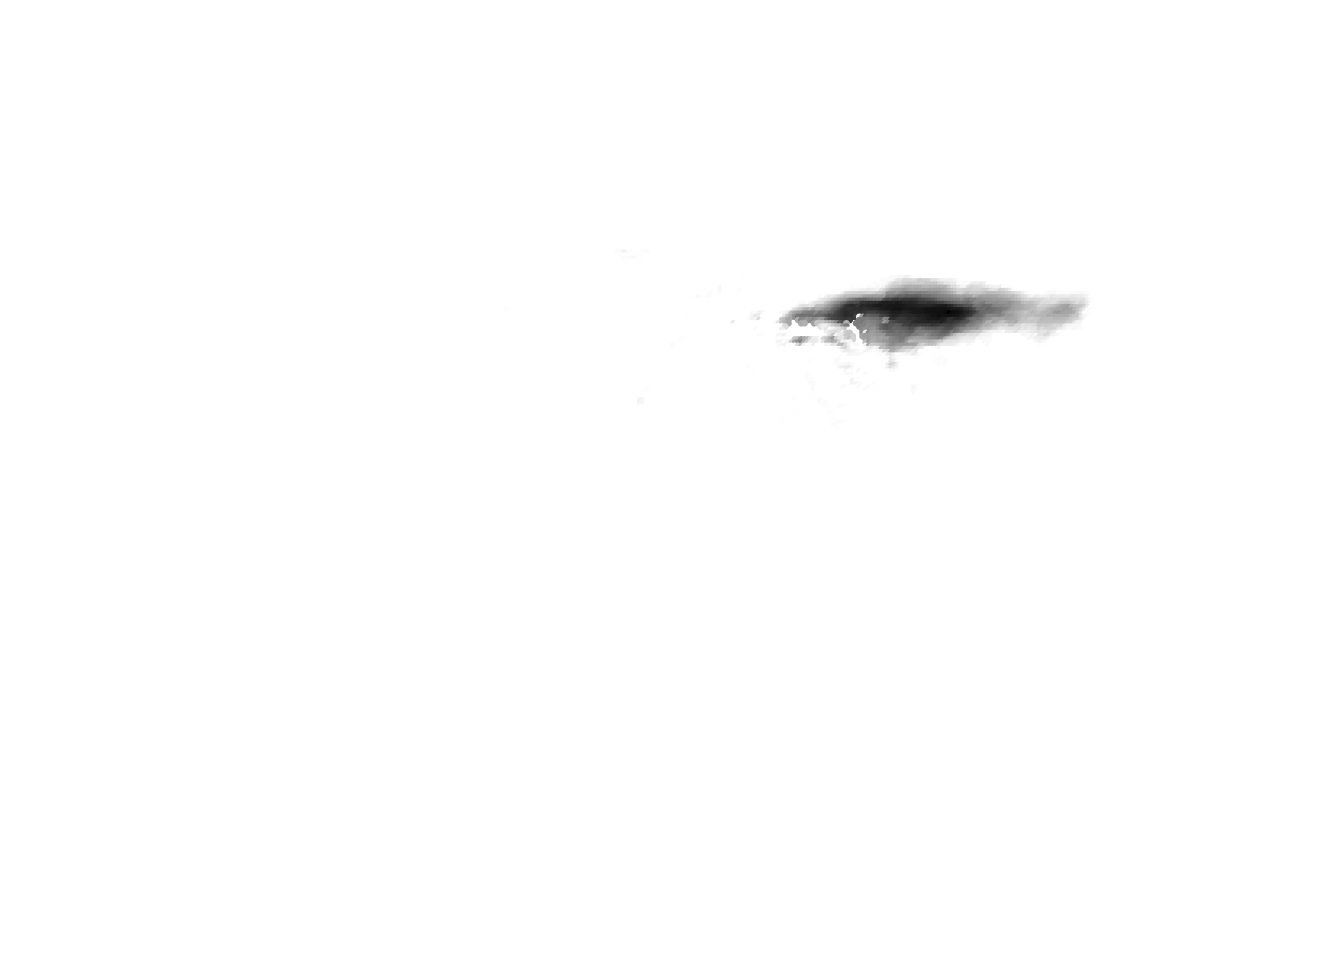
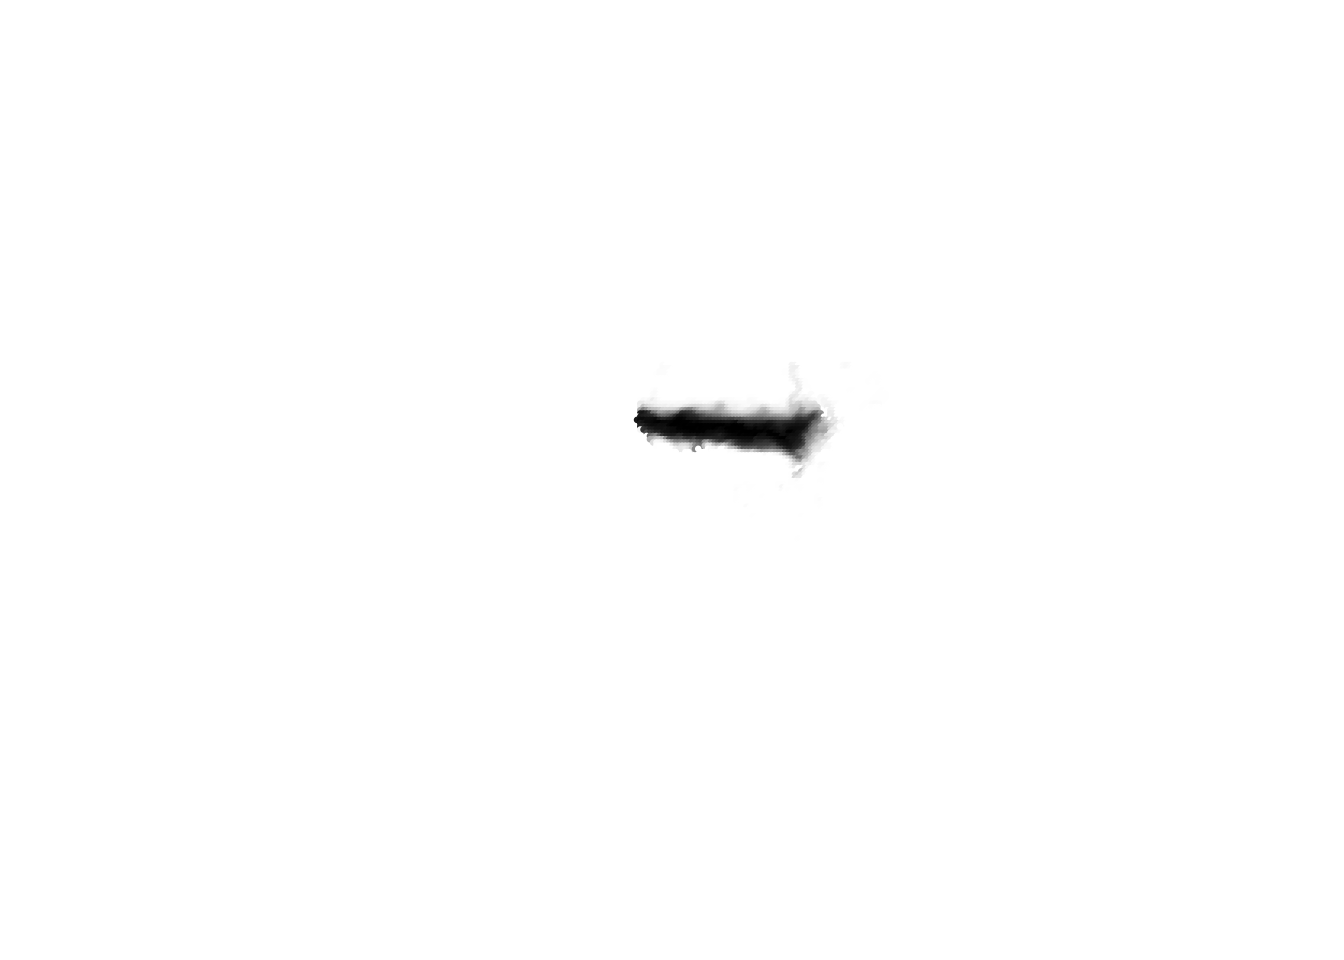
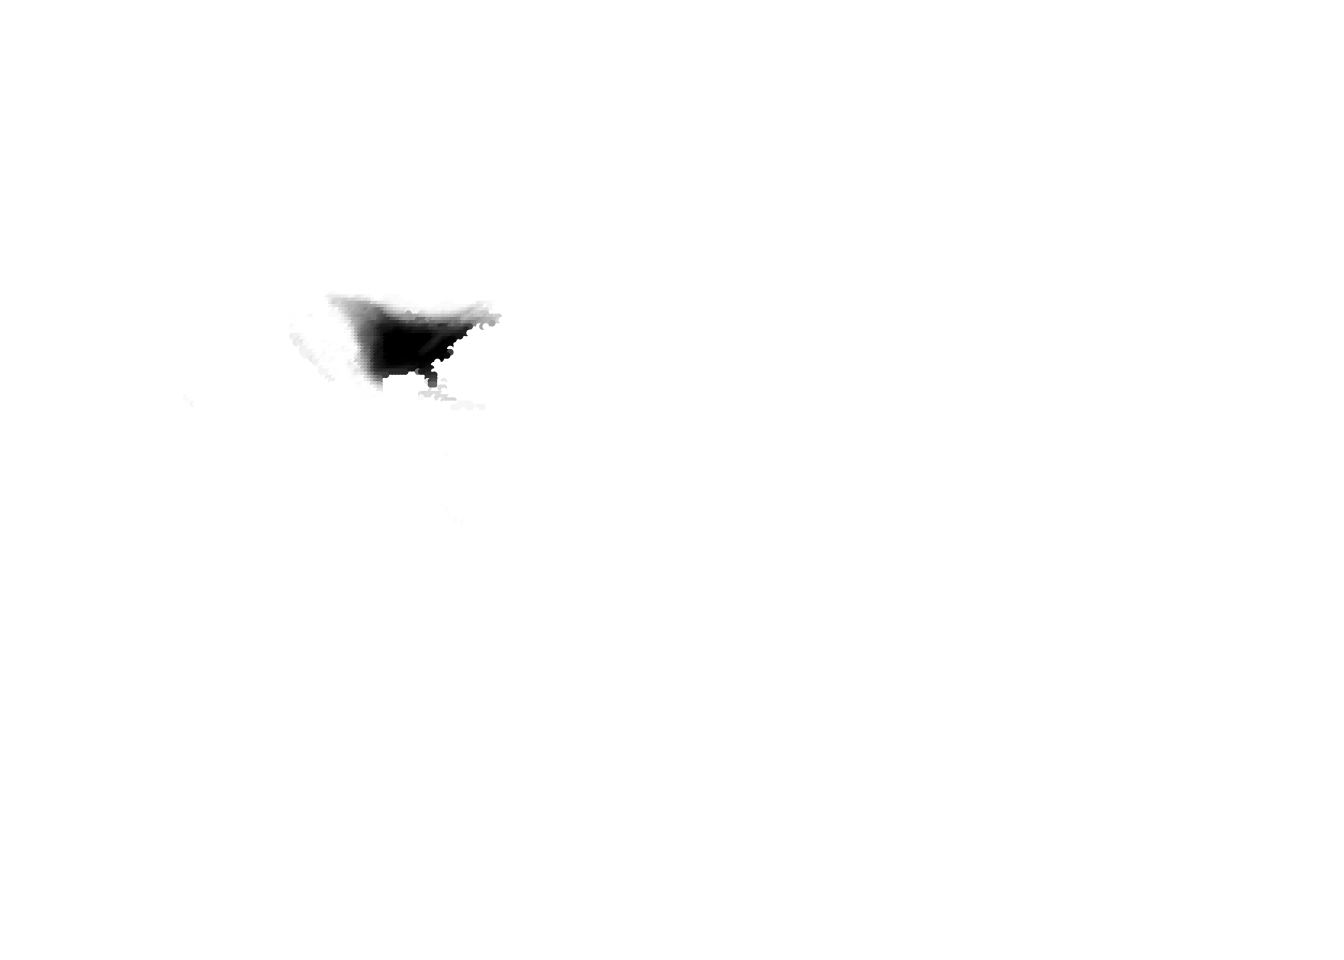
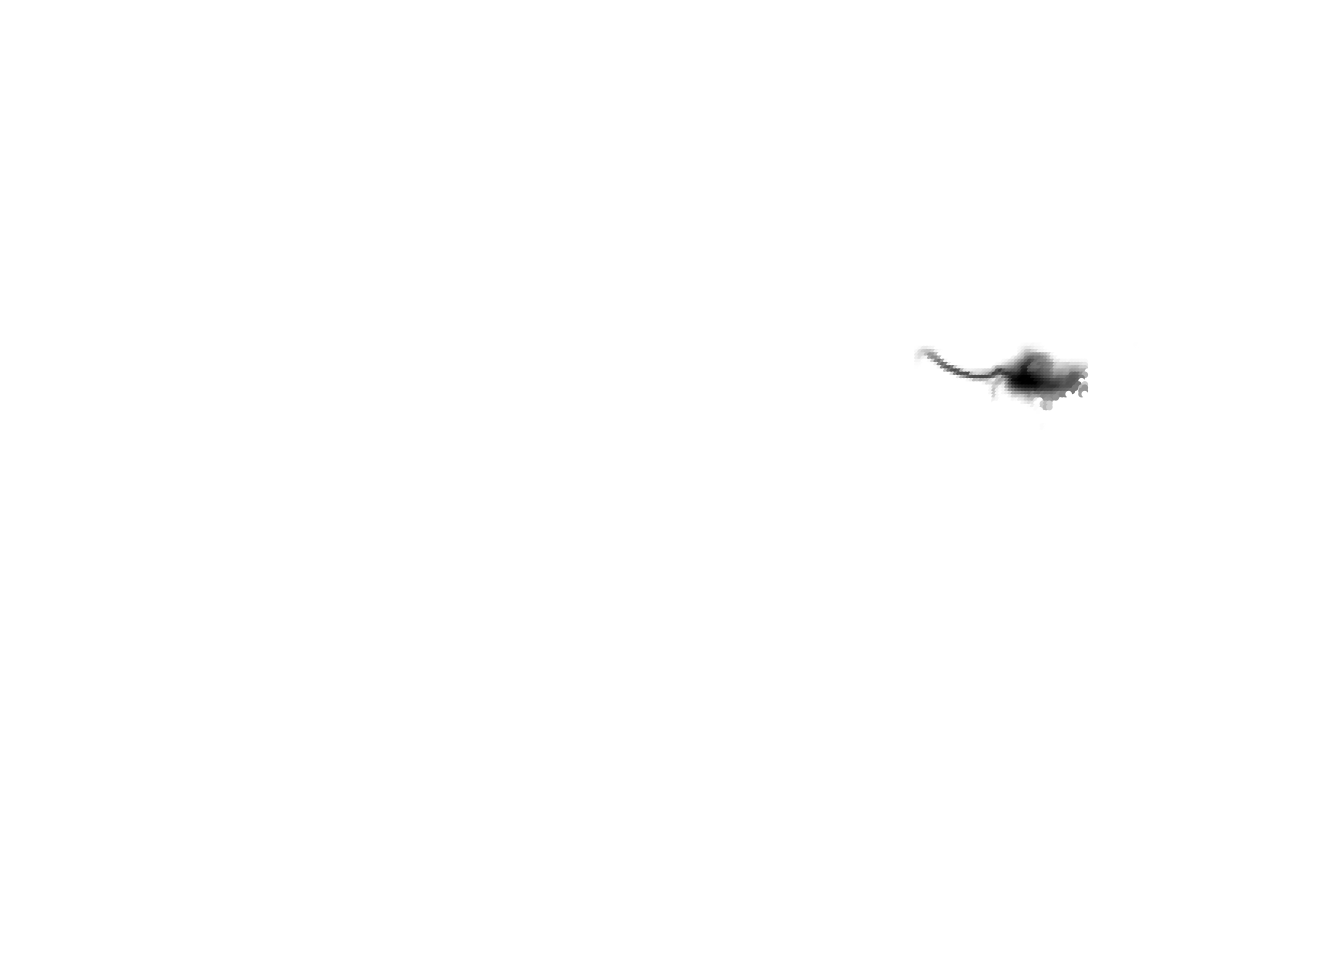
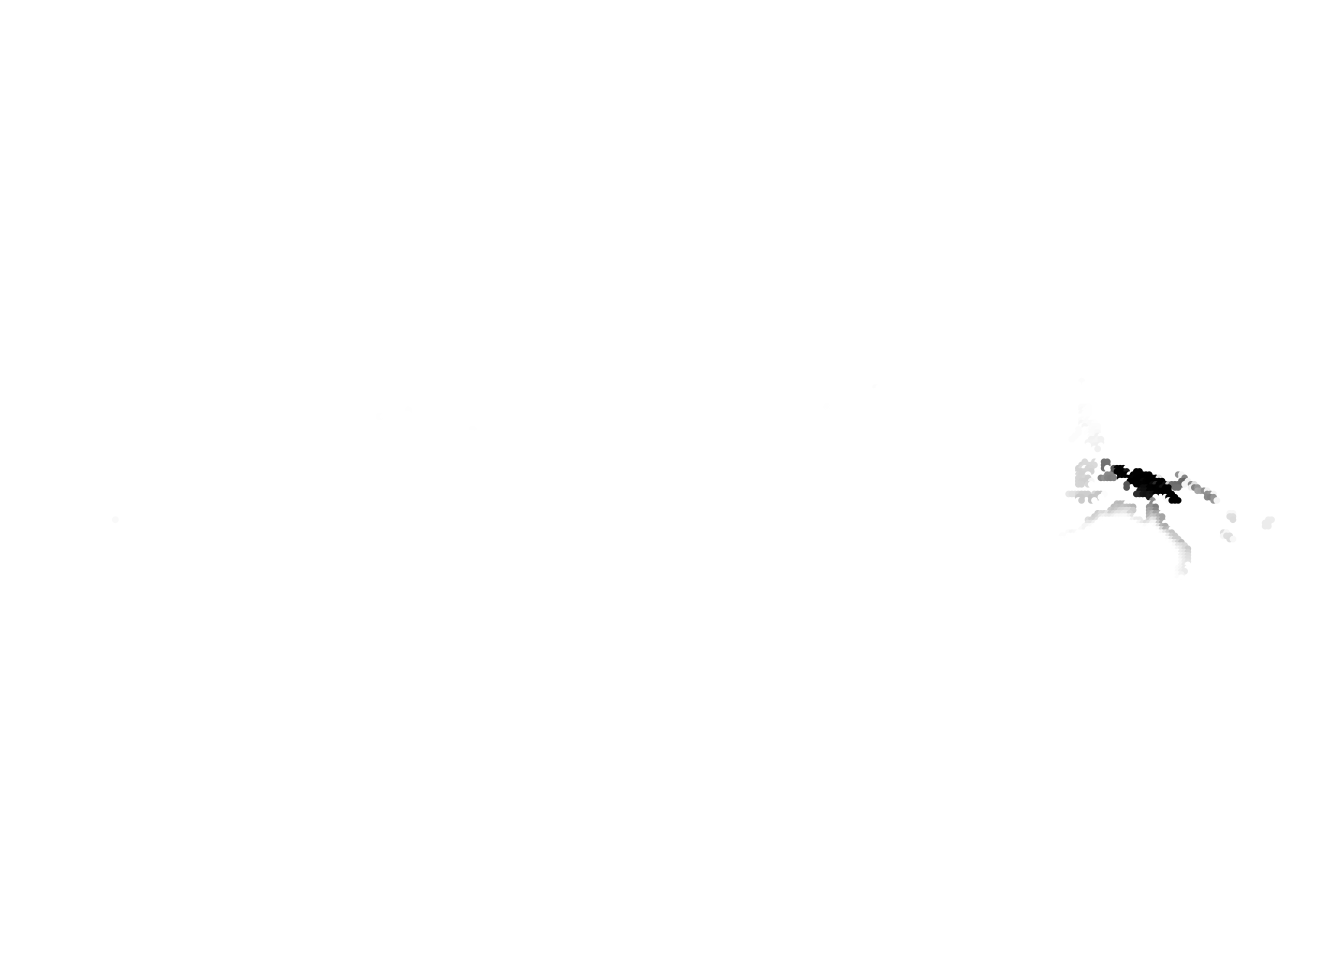
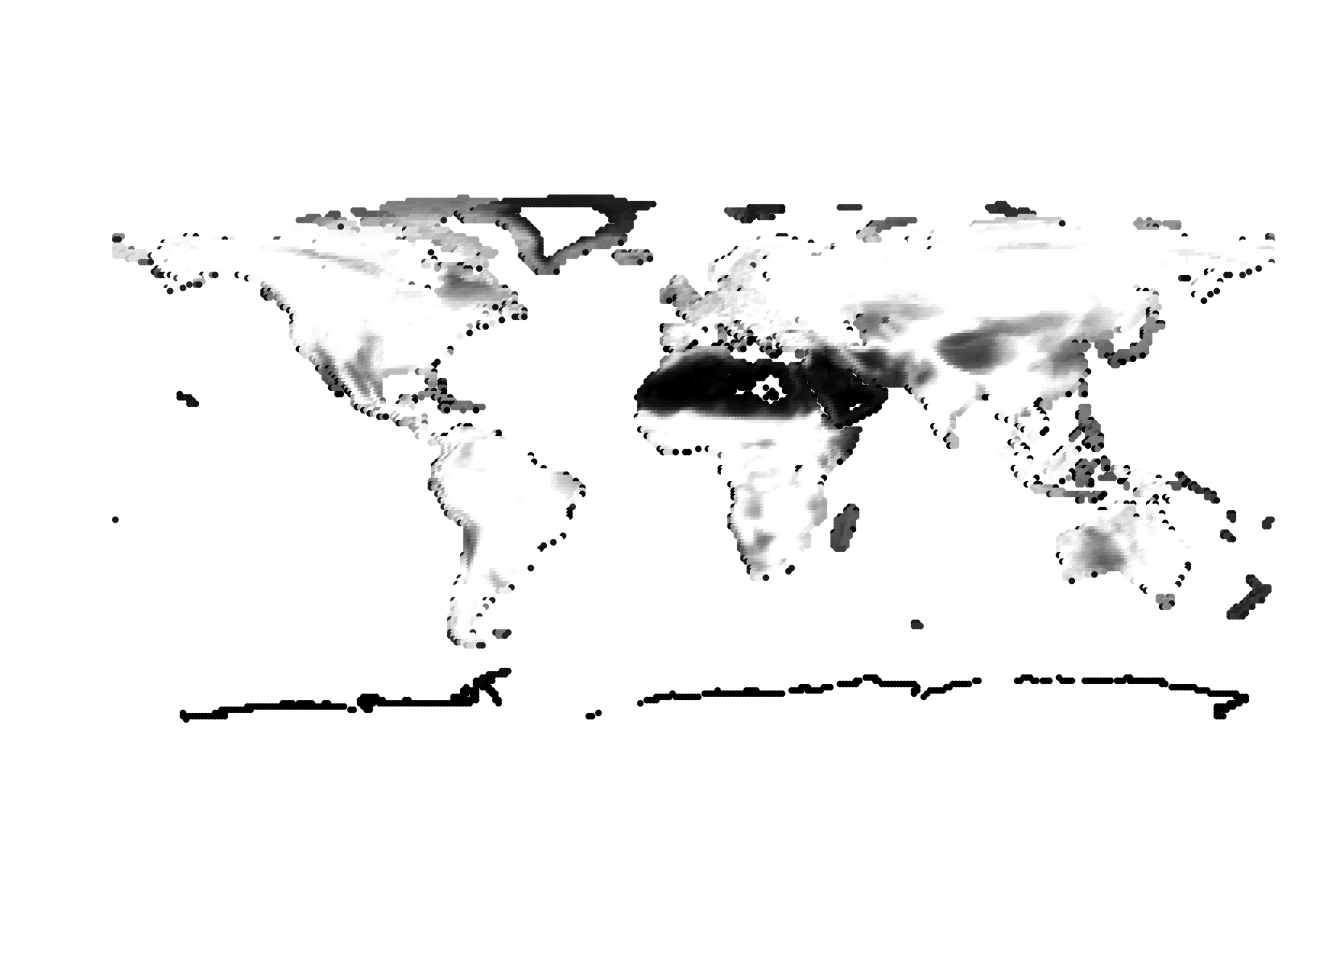
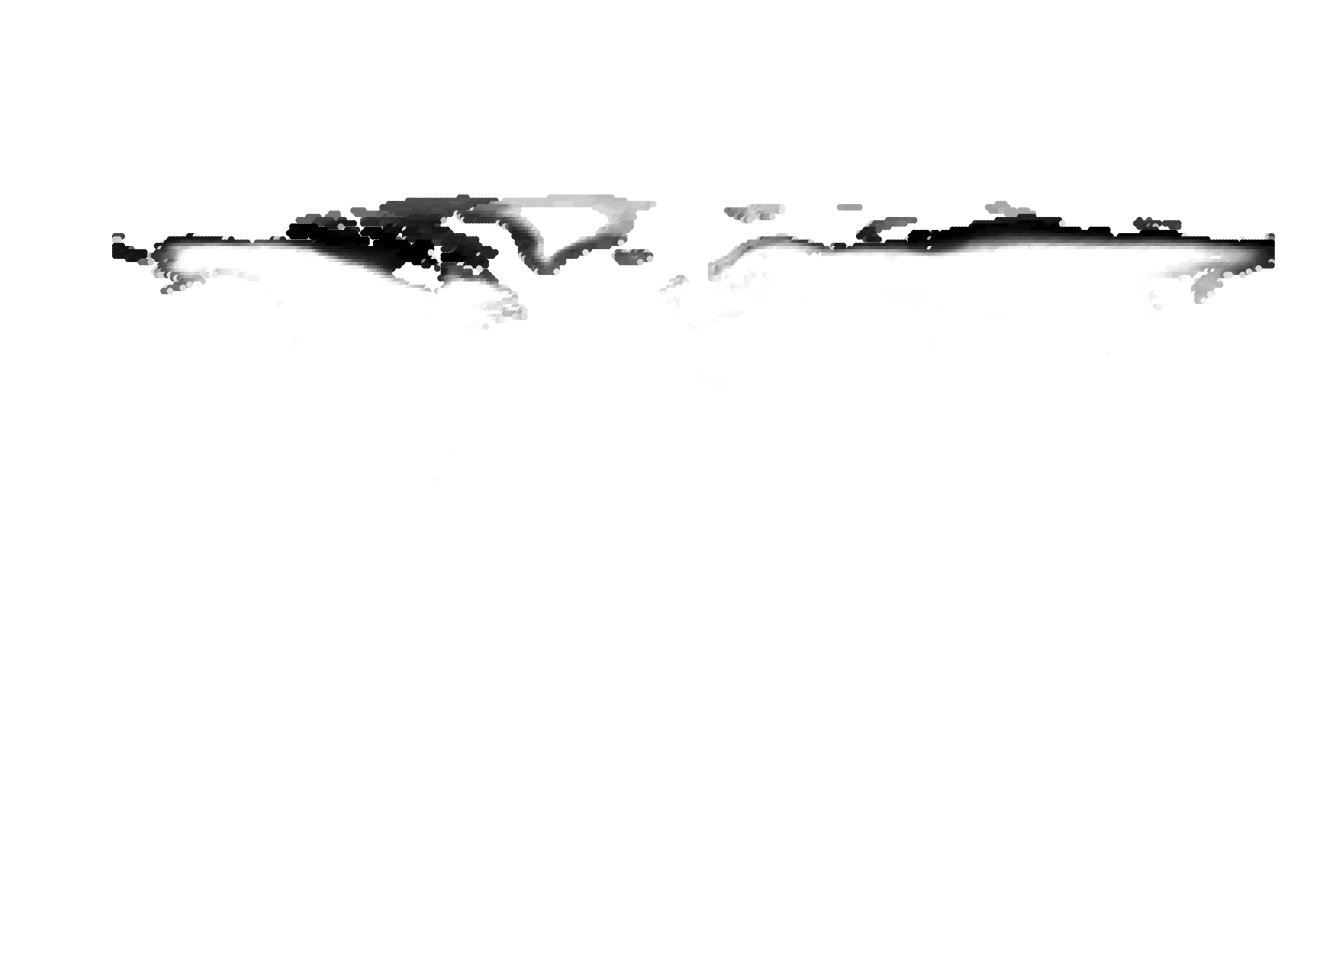
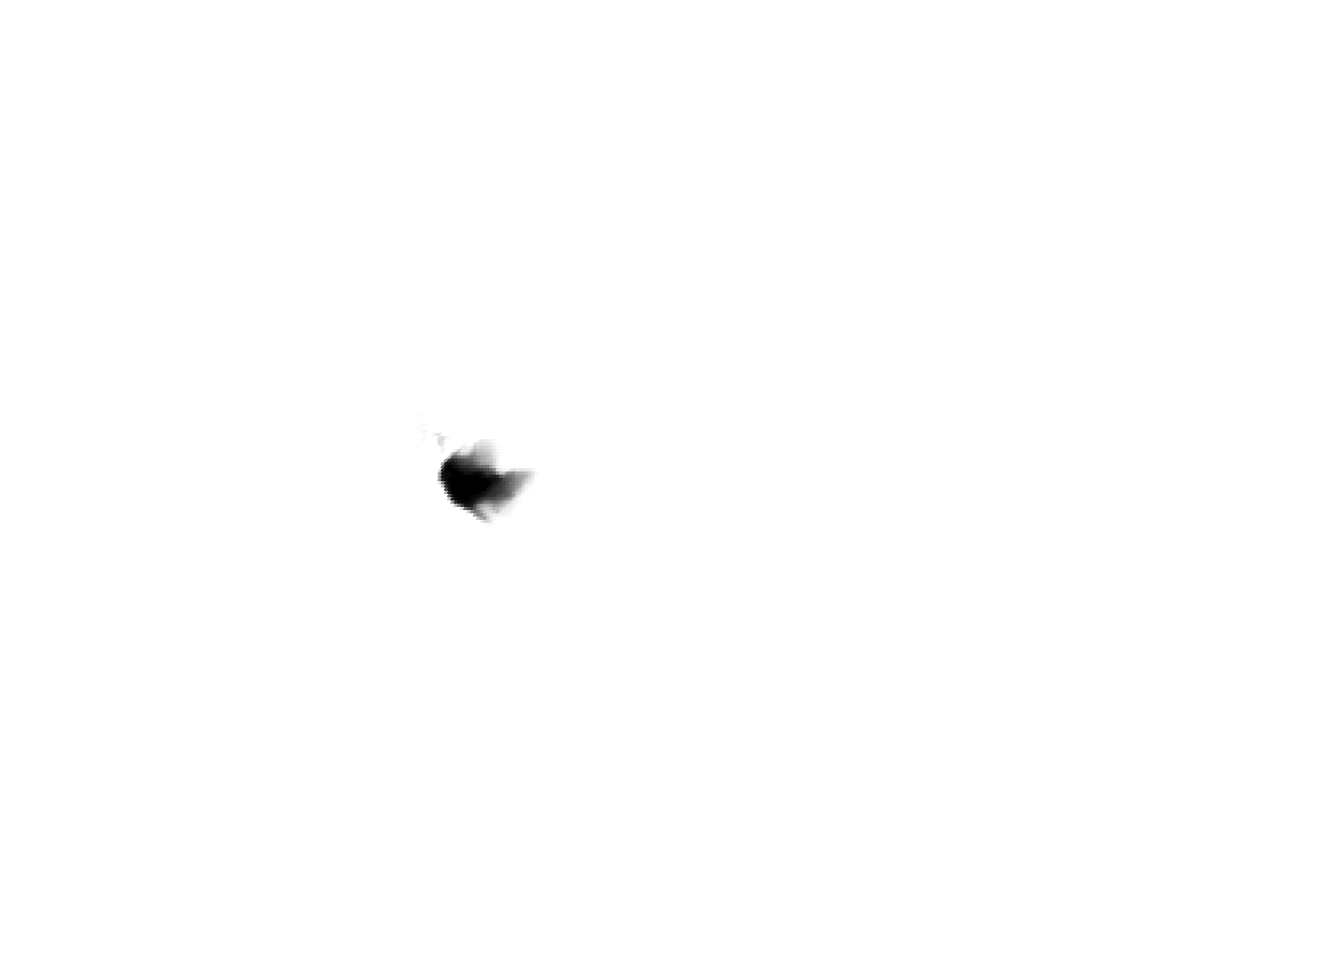
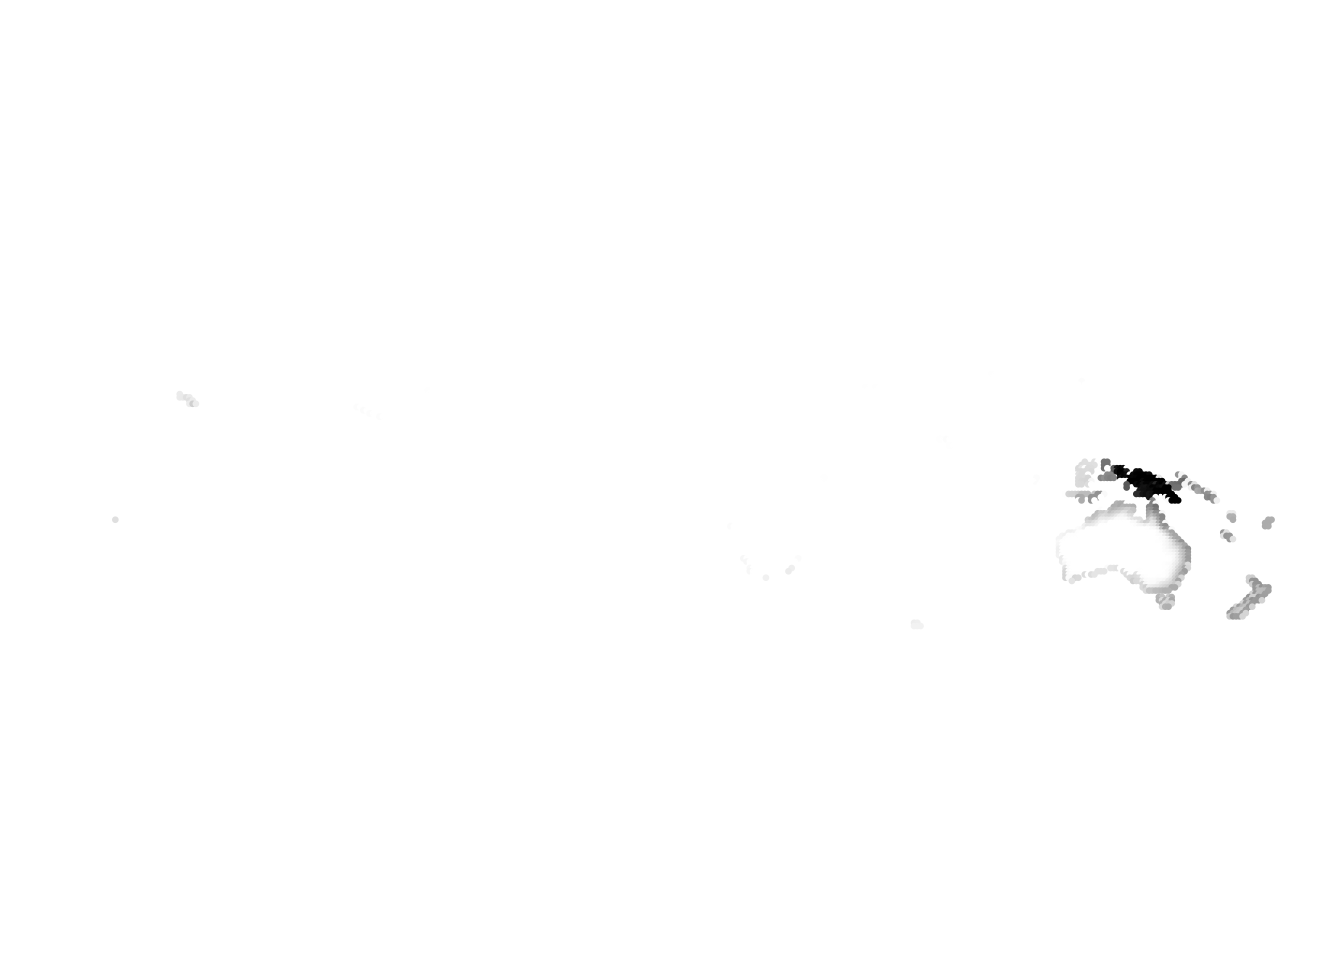
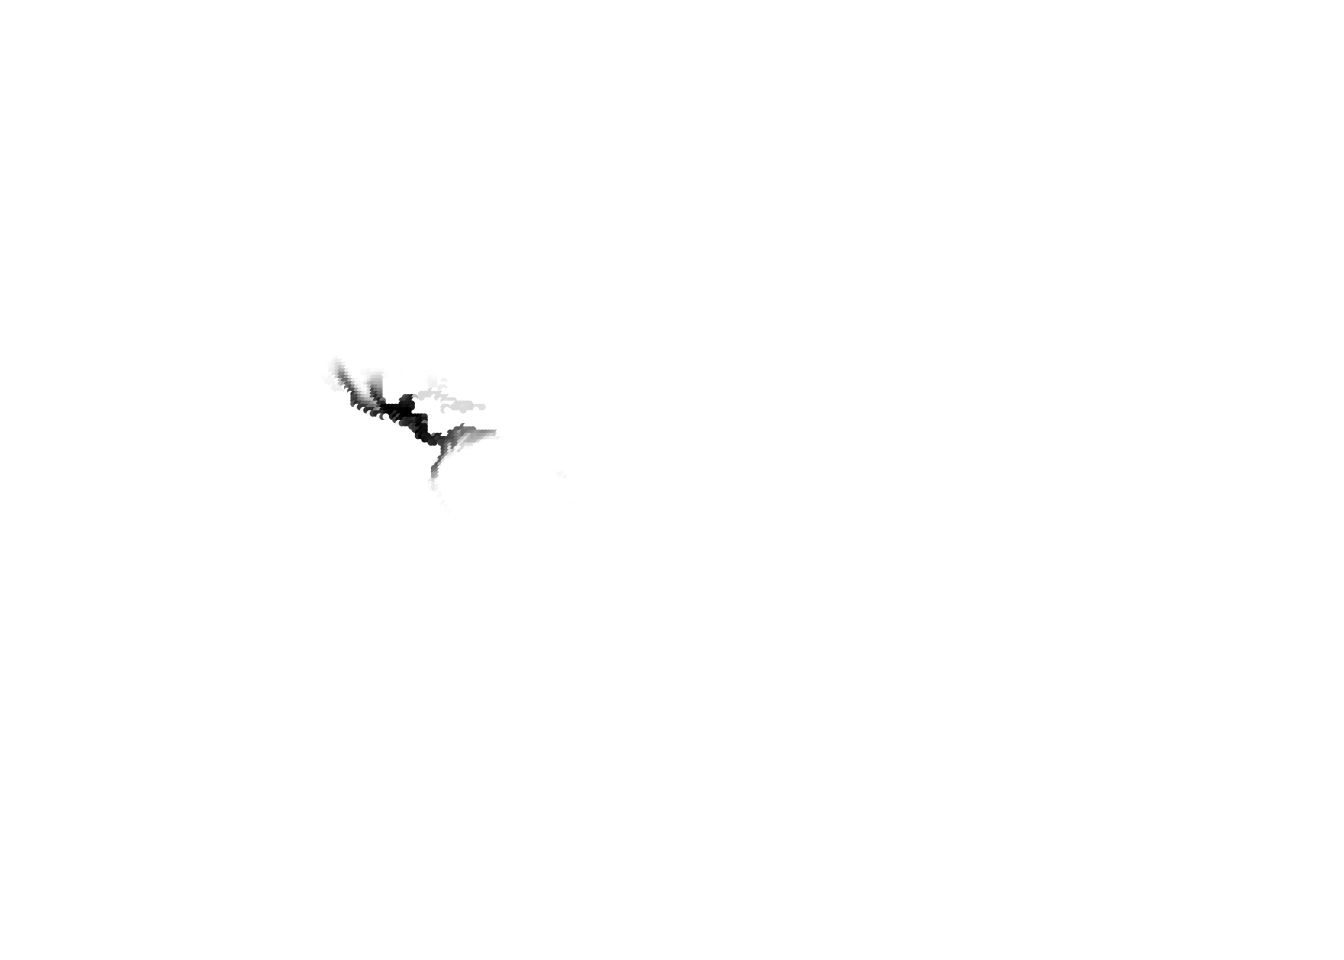
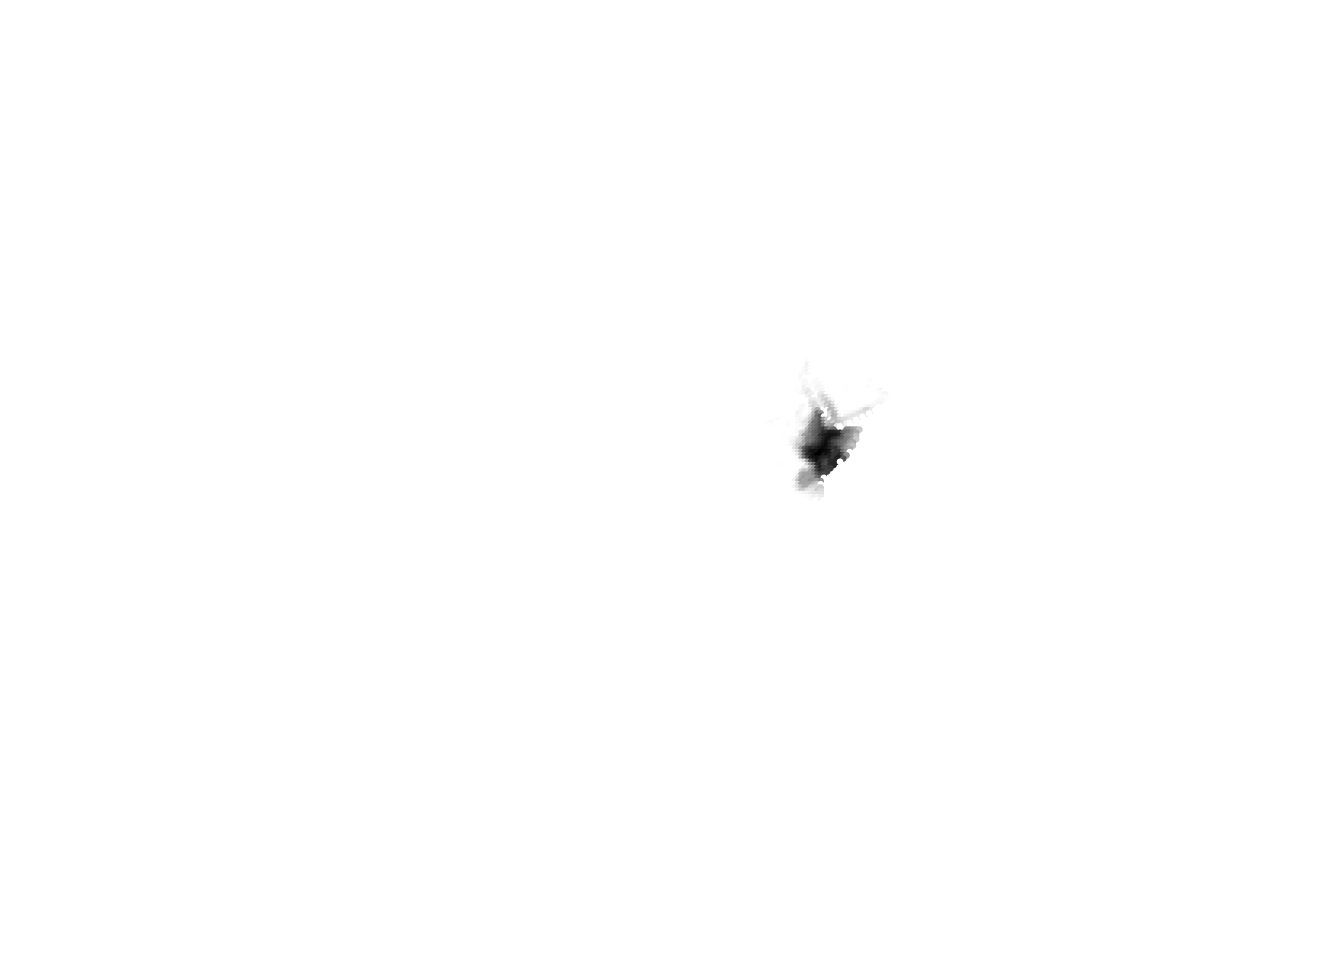
We perform methClust on the global binary presence absence data of around 9500 bird species across approx 17,500 cells.
Plotting function of clusters
latlong <- get(load("../data/LatLongCells_frame.rda"))world_map <- map_data("world")
world_map <- world_map[world_map$region != "Antarctica",] # intercourse antarctica
p <- ggplot() + coord_fixed() +
xlab("") + ylab("")
#Add map to base plot
base_world_messy <- p + geom_map(data=world_map, map = world_map, aes(group=group, map_id=region), colour="white", fill="white", size=0.05, alpha=1/4)
cleanup <-
theme(panel.grid.major = element_blank(), panel.grid.minor = element_blank(),
panel.background = element_rect(fill = 'white', colour = 'white'),
axis.line = element_line(colour = "white"), legend.position="none",
axis.ticks=element_blank(), axis.text.x=element_blank(),
axis.text.y=element_blank())
base_world <- base_world_messy + cleanupPlotAssemblageIdx <- function(dat){
dat <- cbind.data.frame(latlong, dat)
colnames(dat) <- c("Latitude", "Longitude", "Value")
map_data_coloured <-
base_world +
geom_point(data=dat,
aes(x=Latitude, y=Longitude, colour=Value), size=0.5) +
scale_colour_gradient(low = "white", high = "black")
map_data_coloured
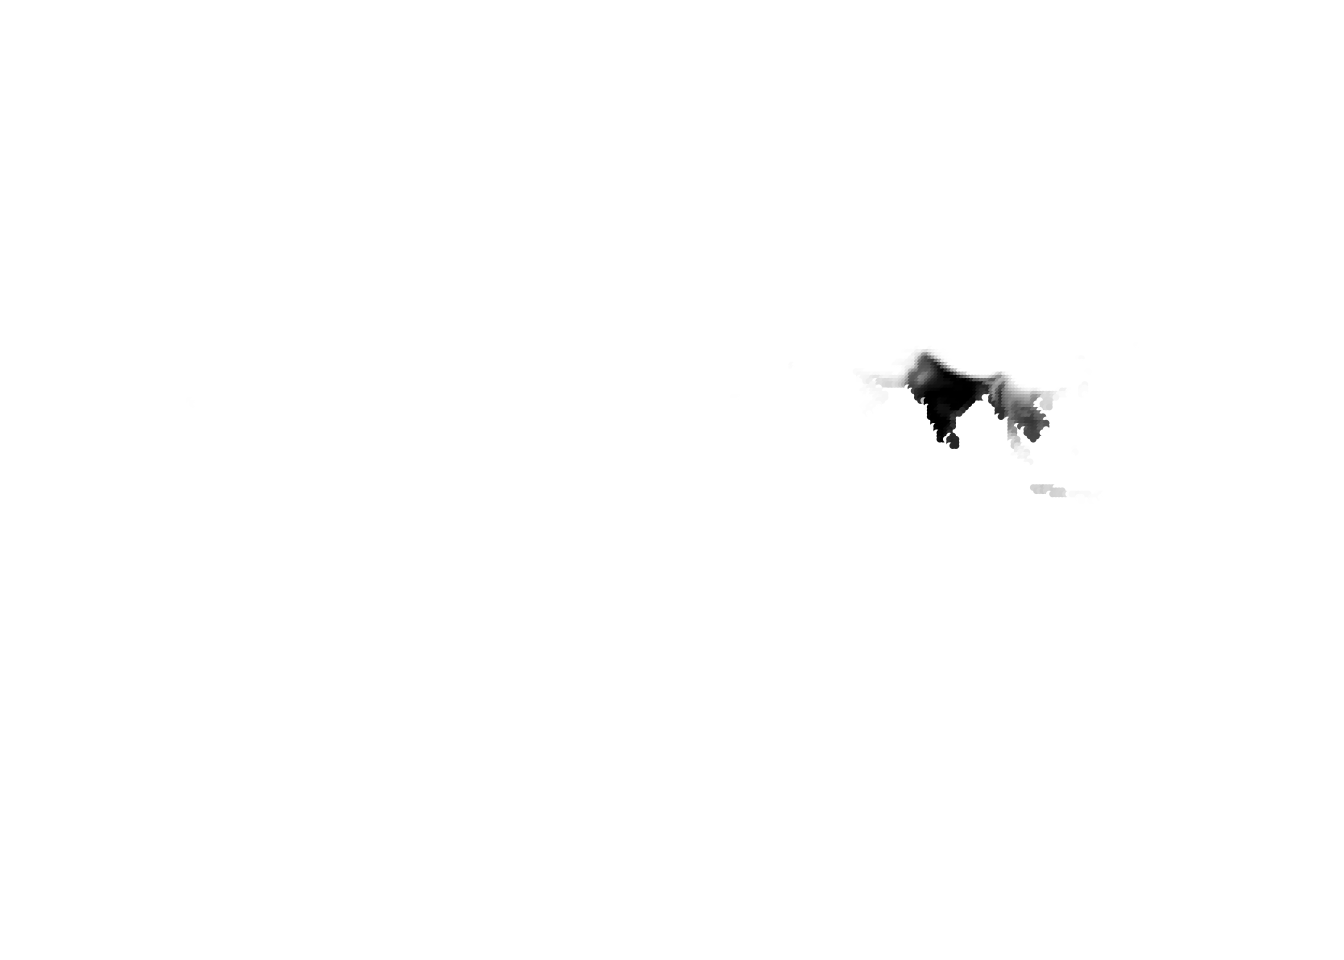
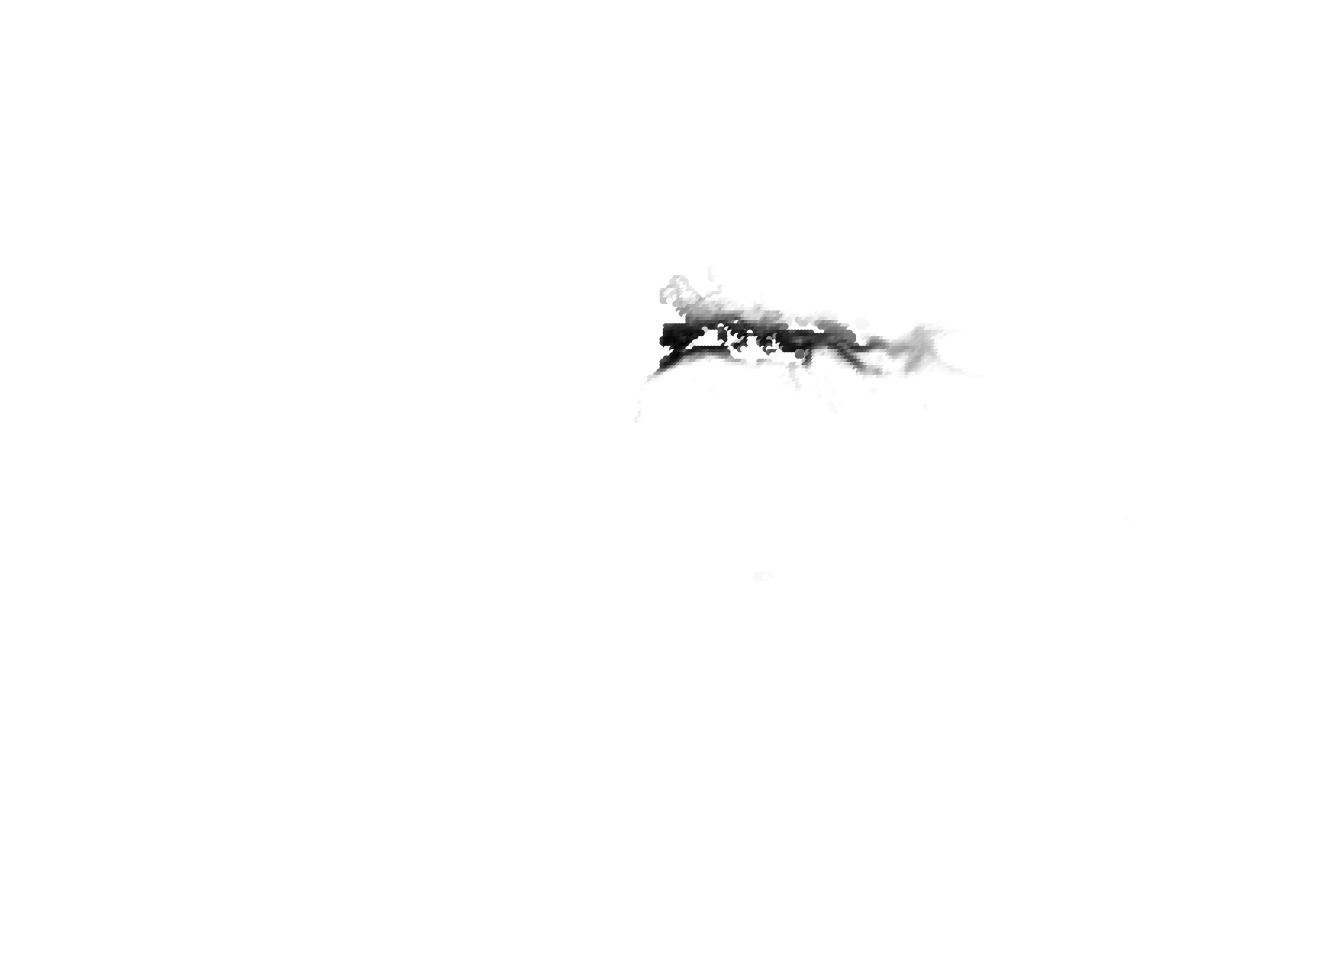
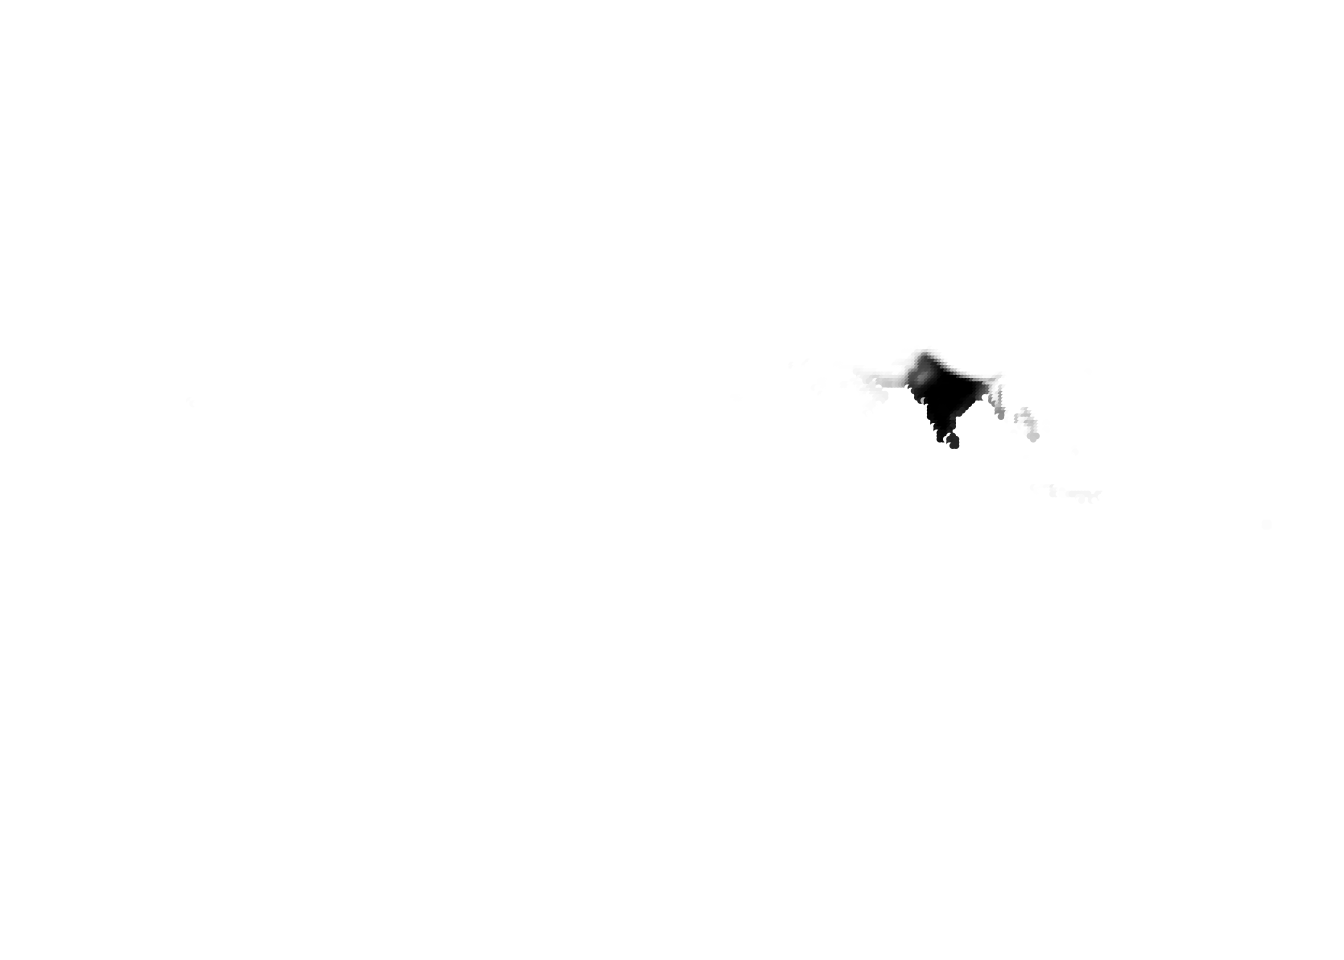
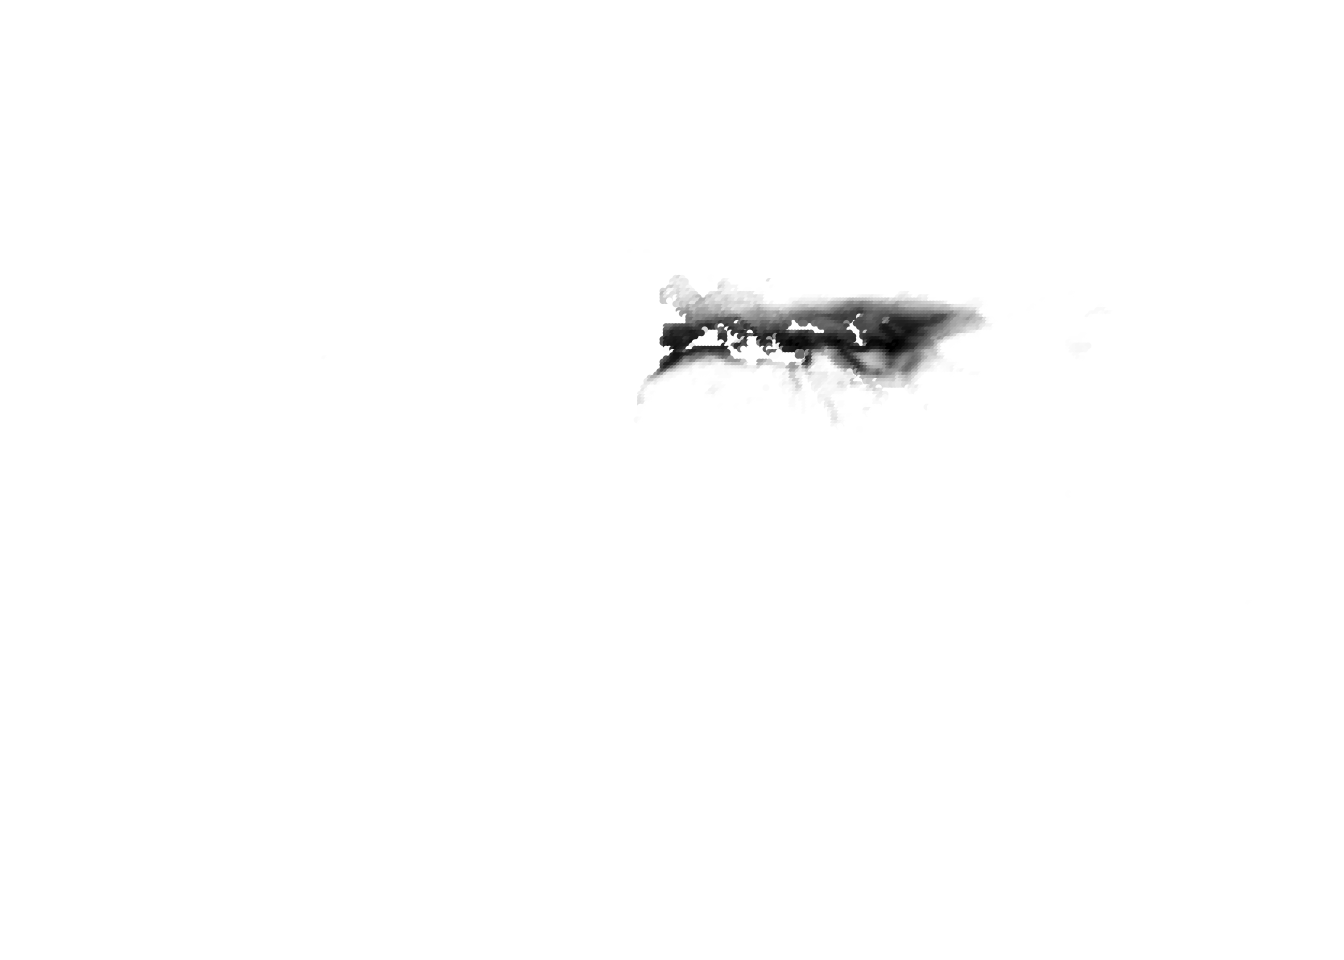
}K = 26
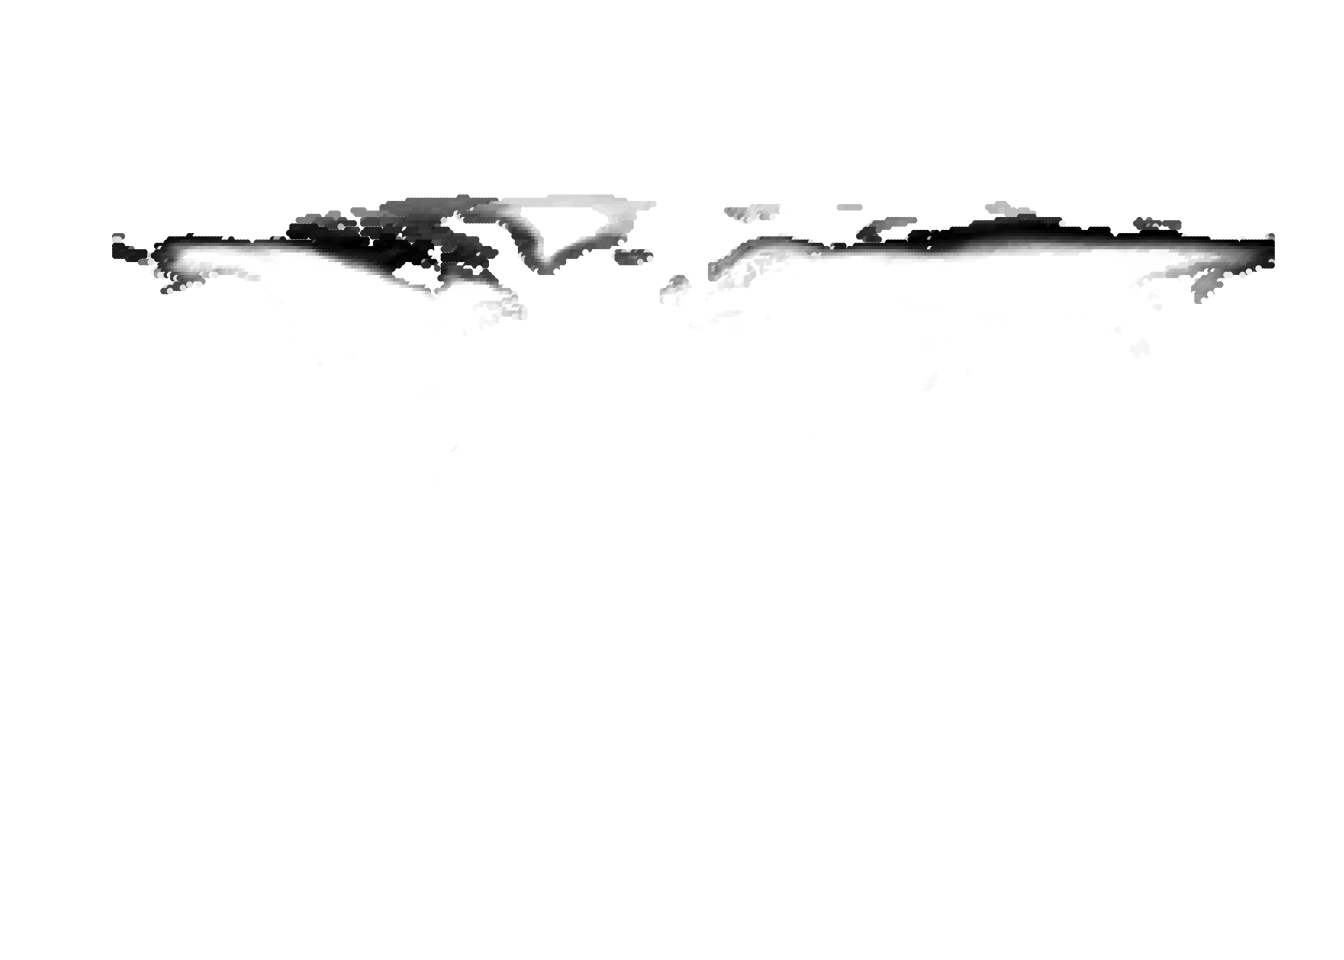


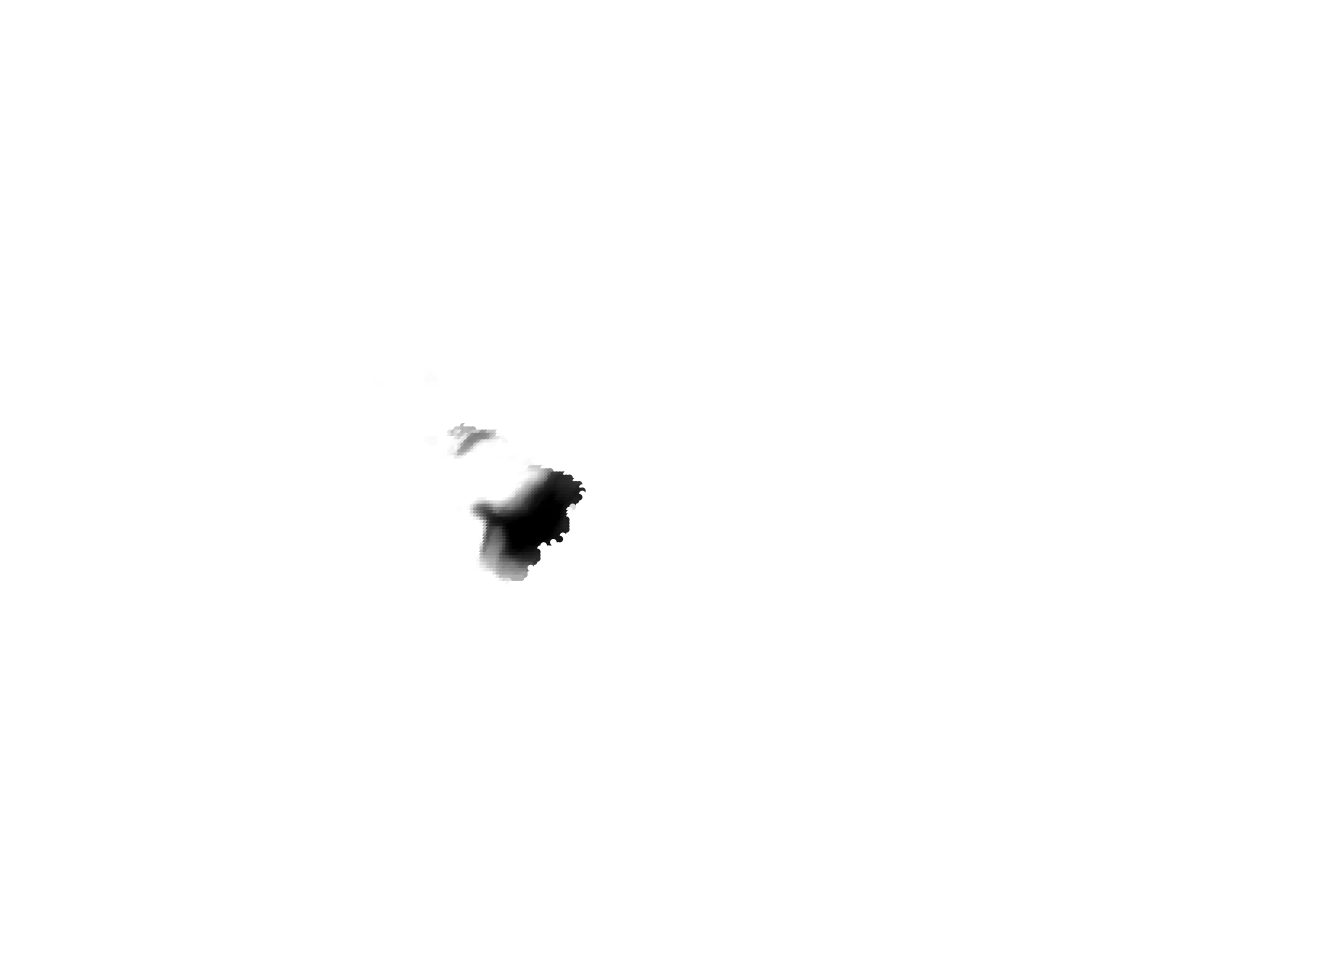


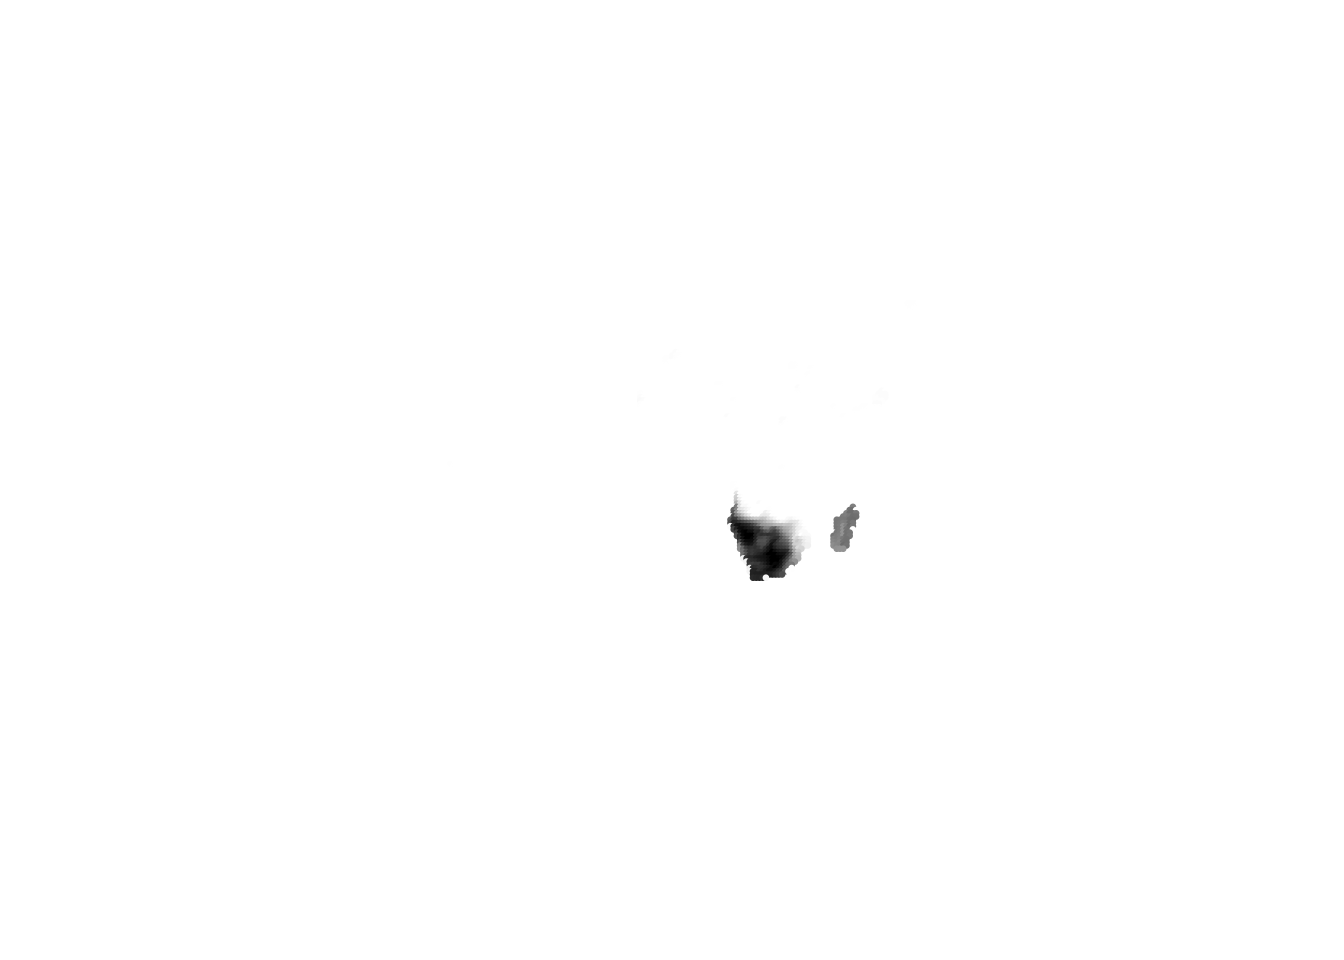


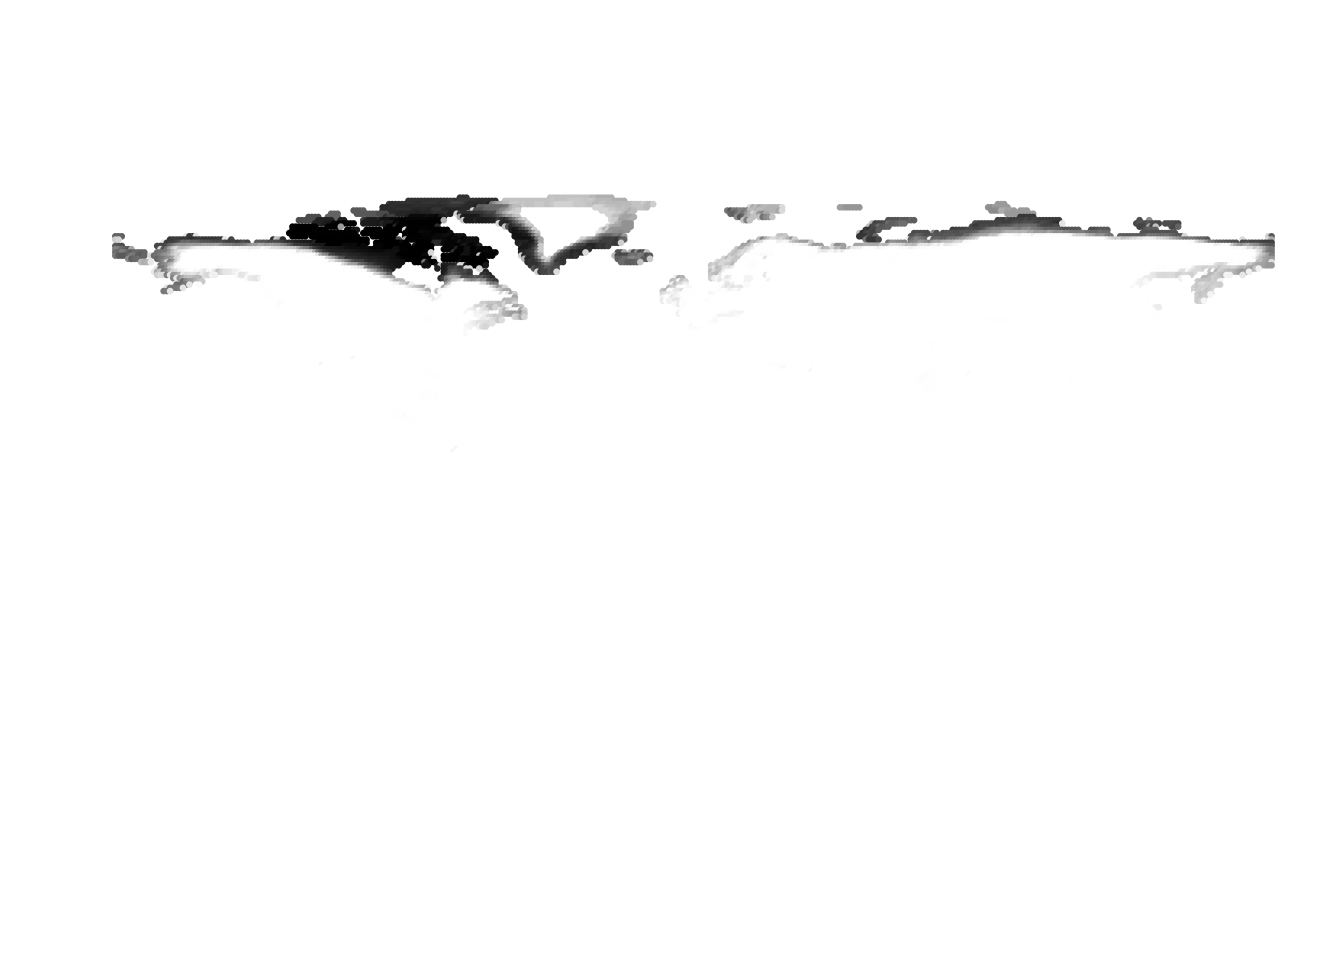
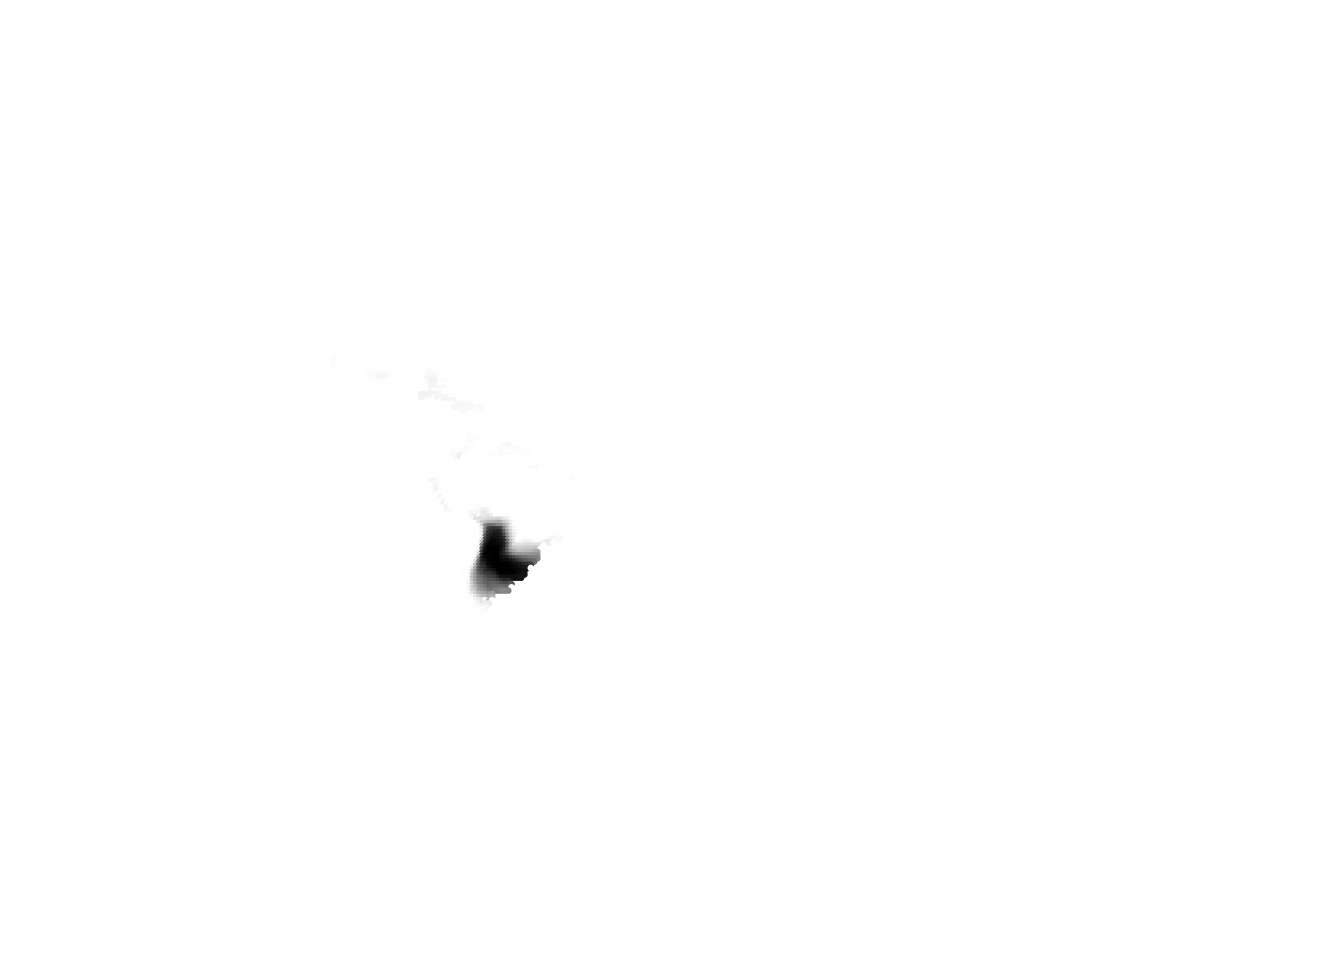
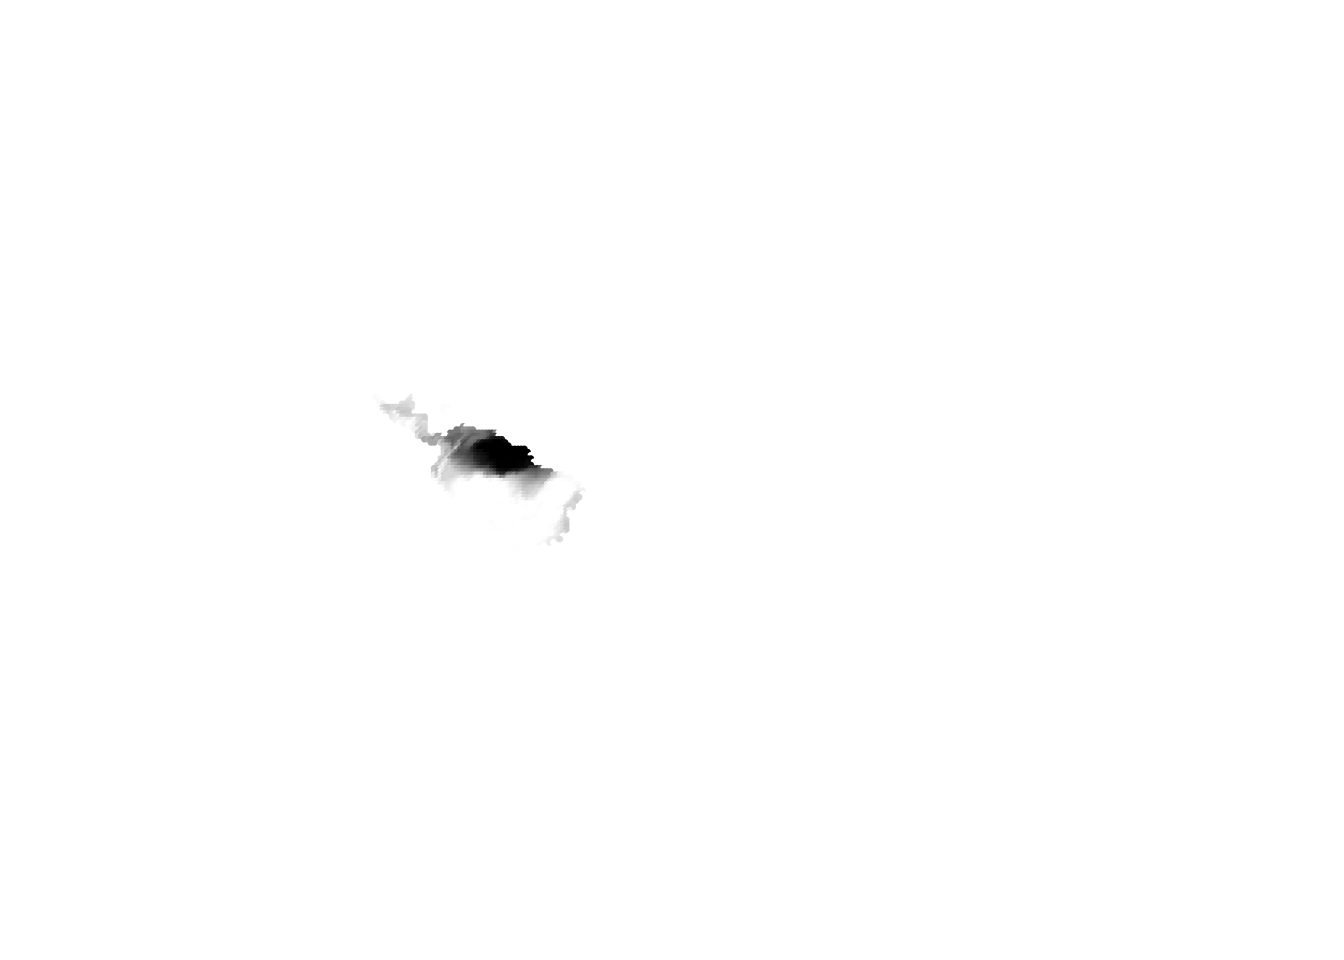
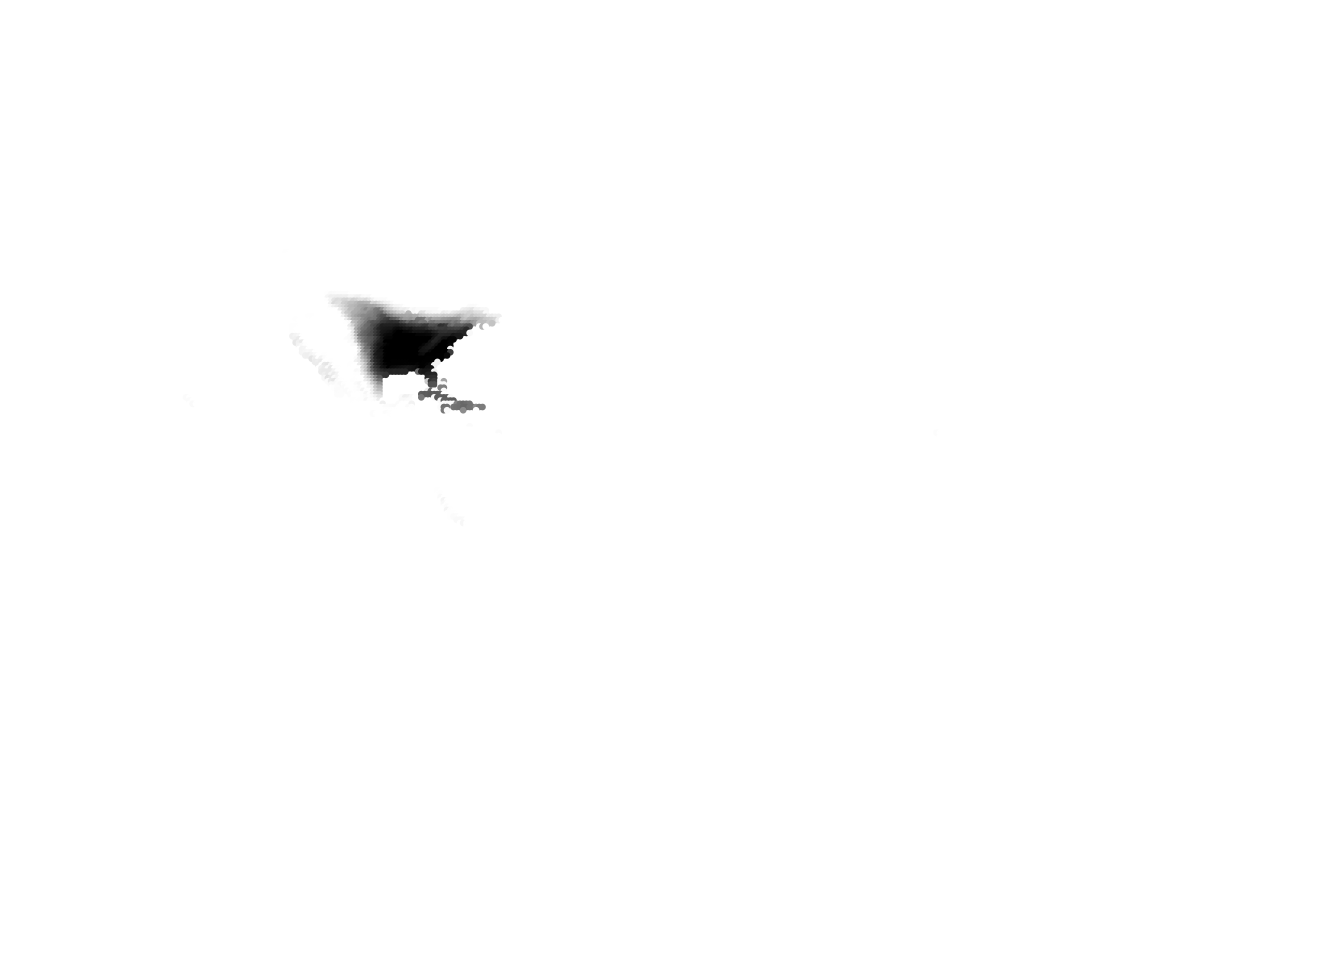
K = 29

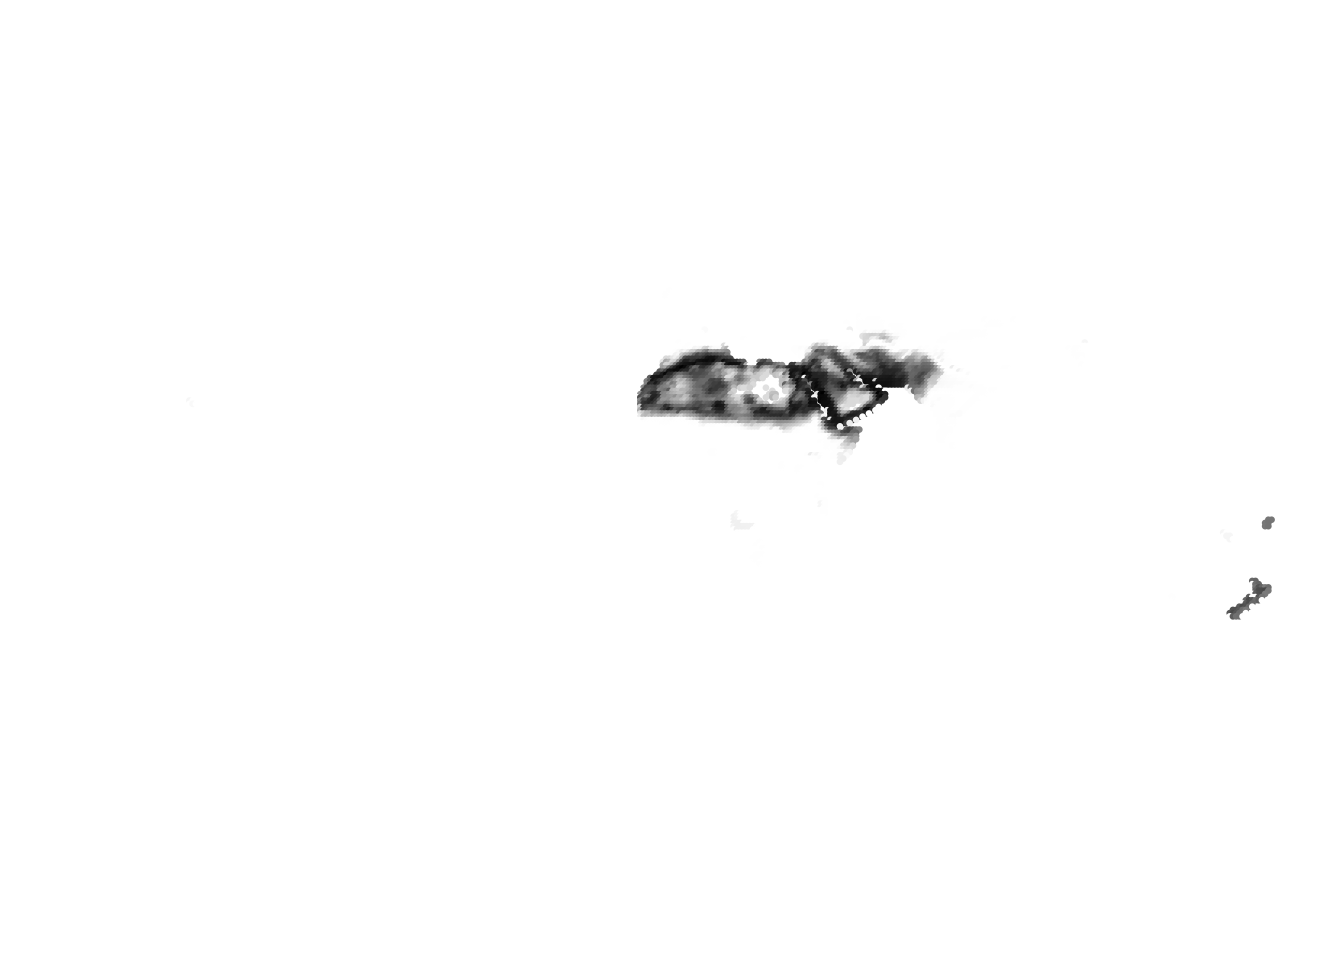


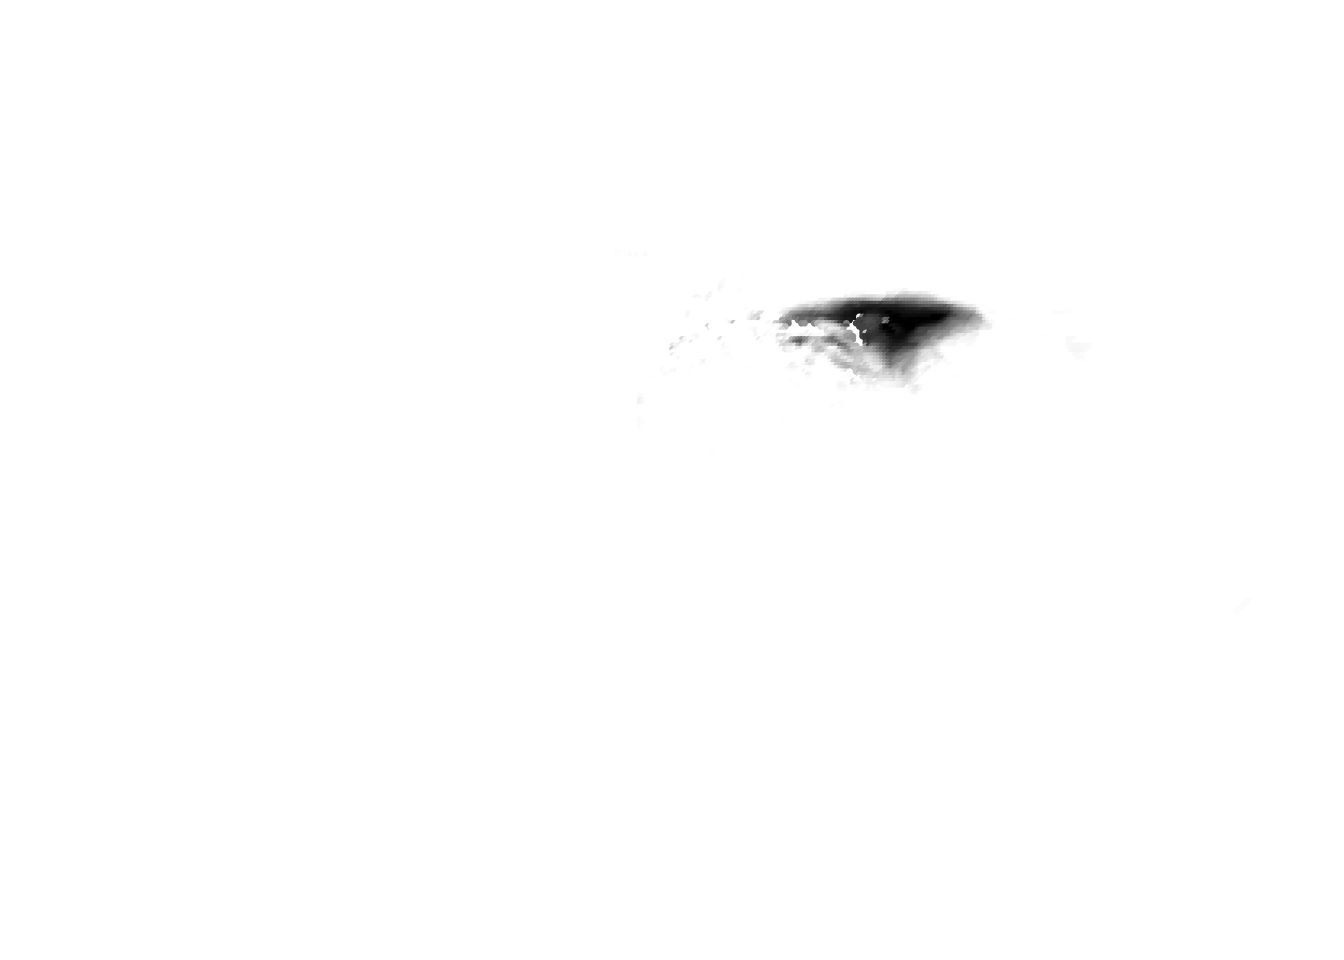


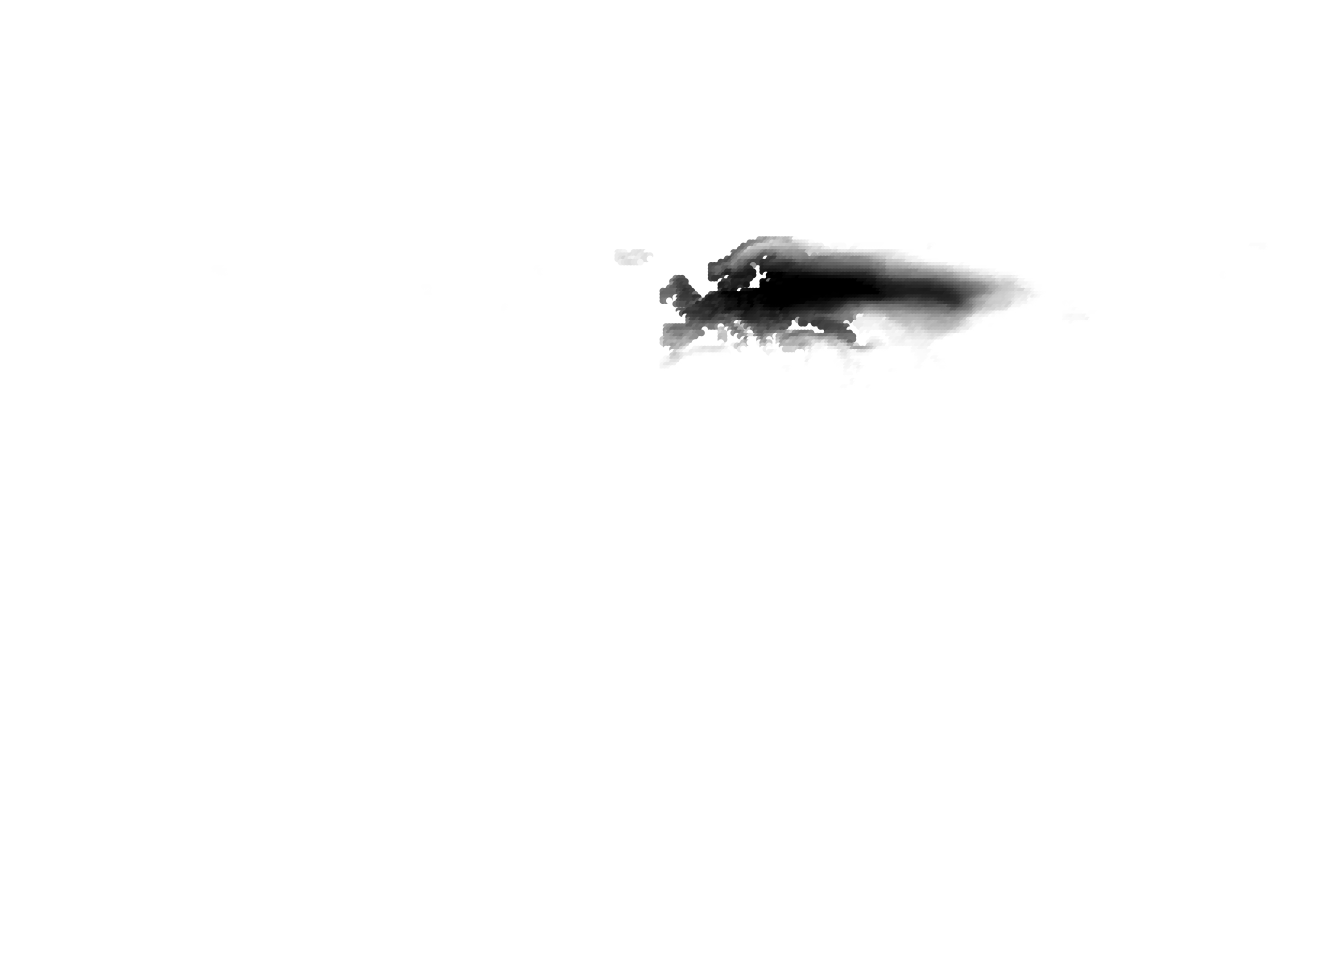
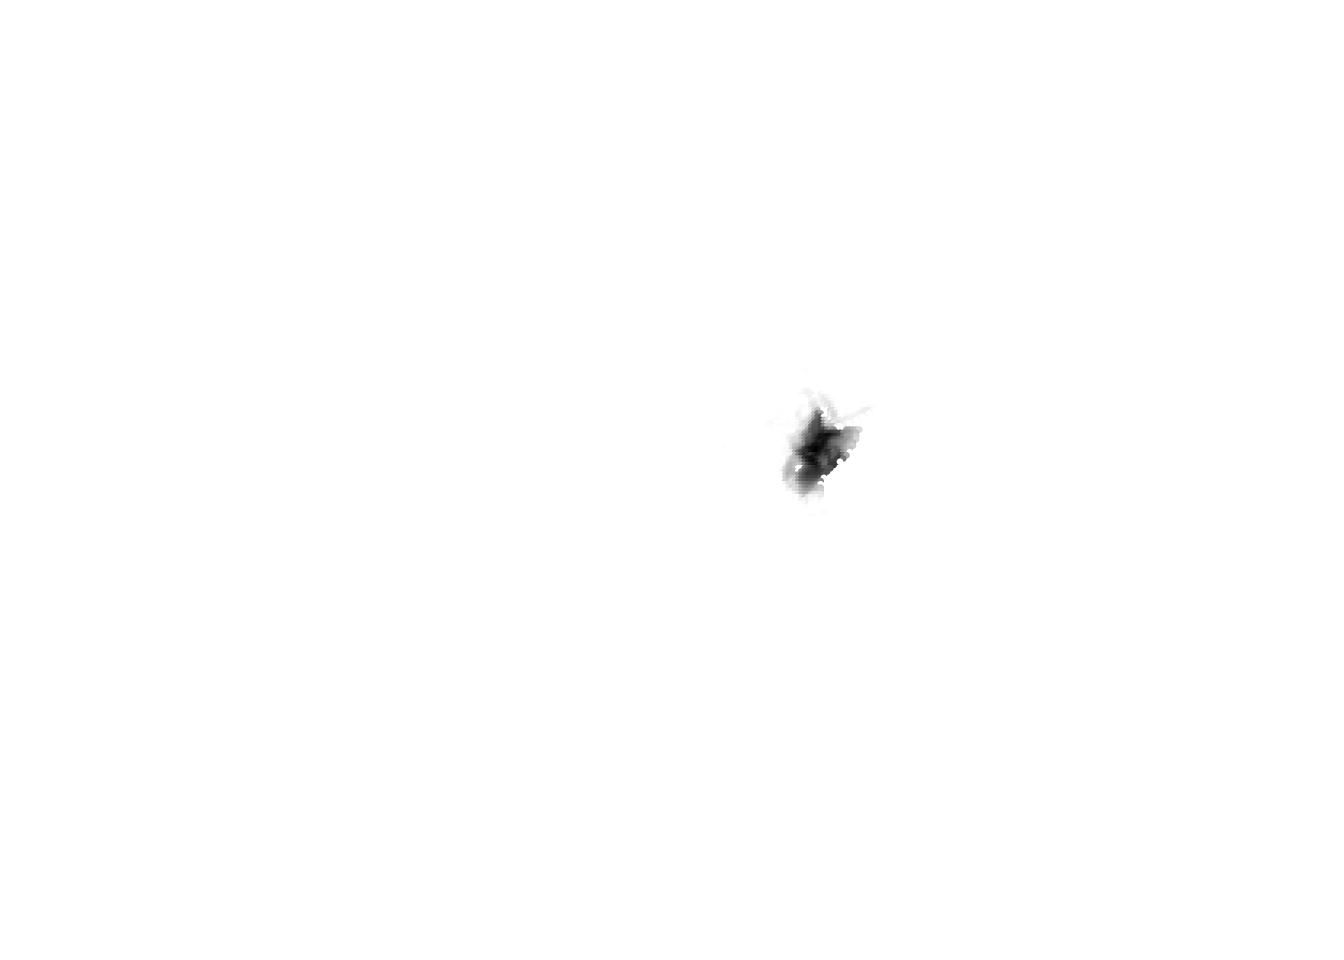
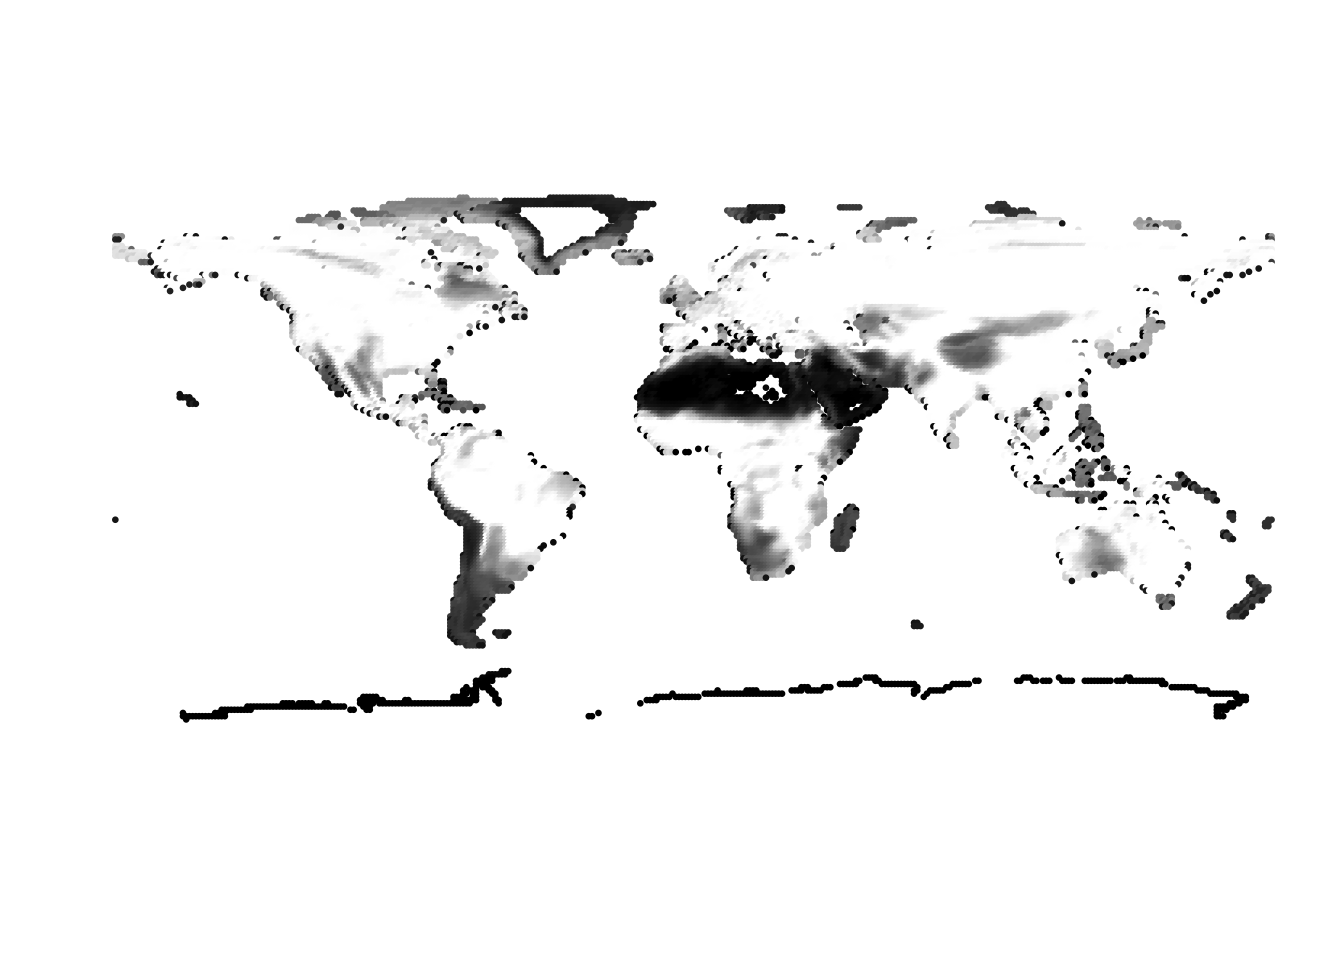
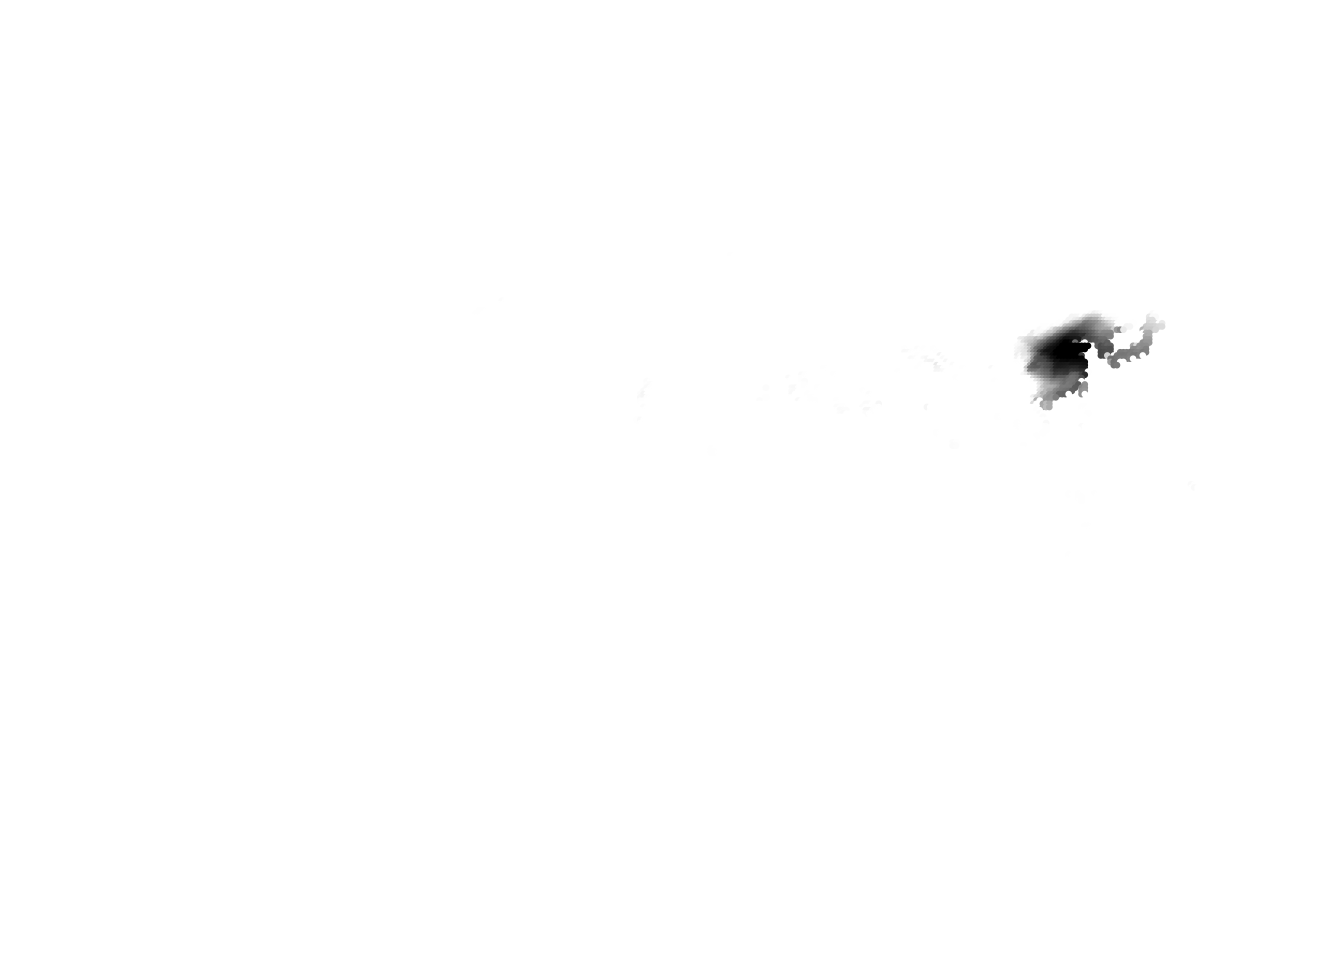
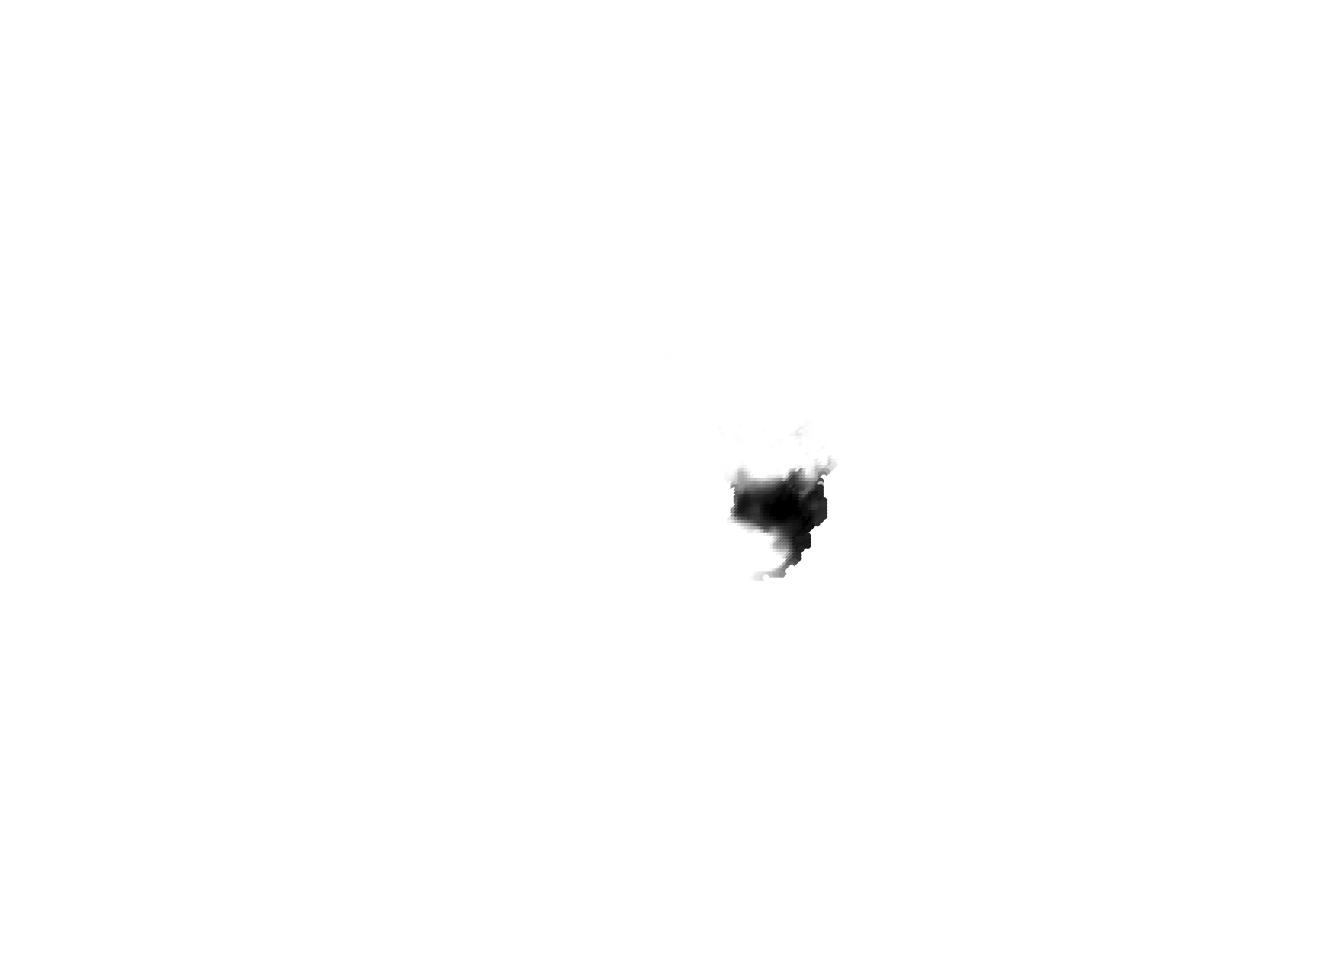
K = 31
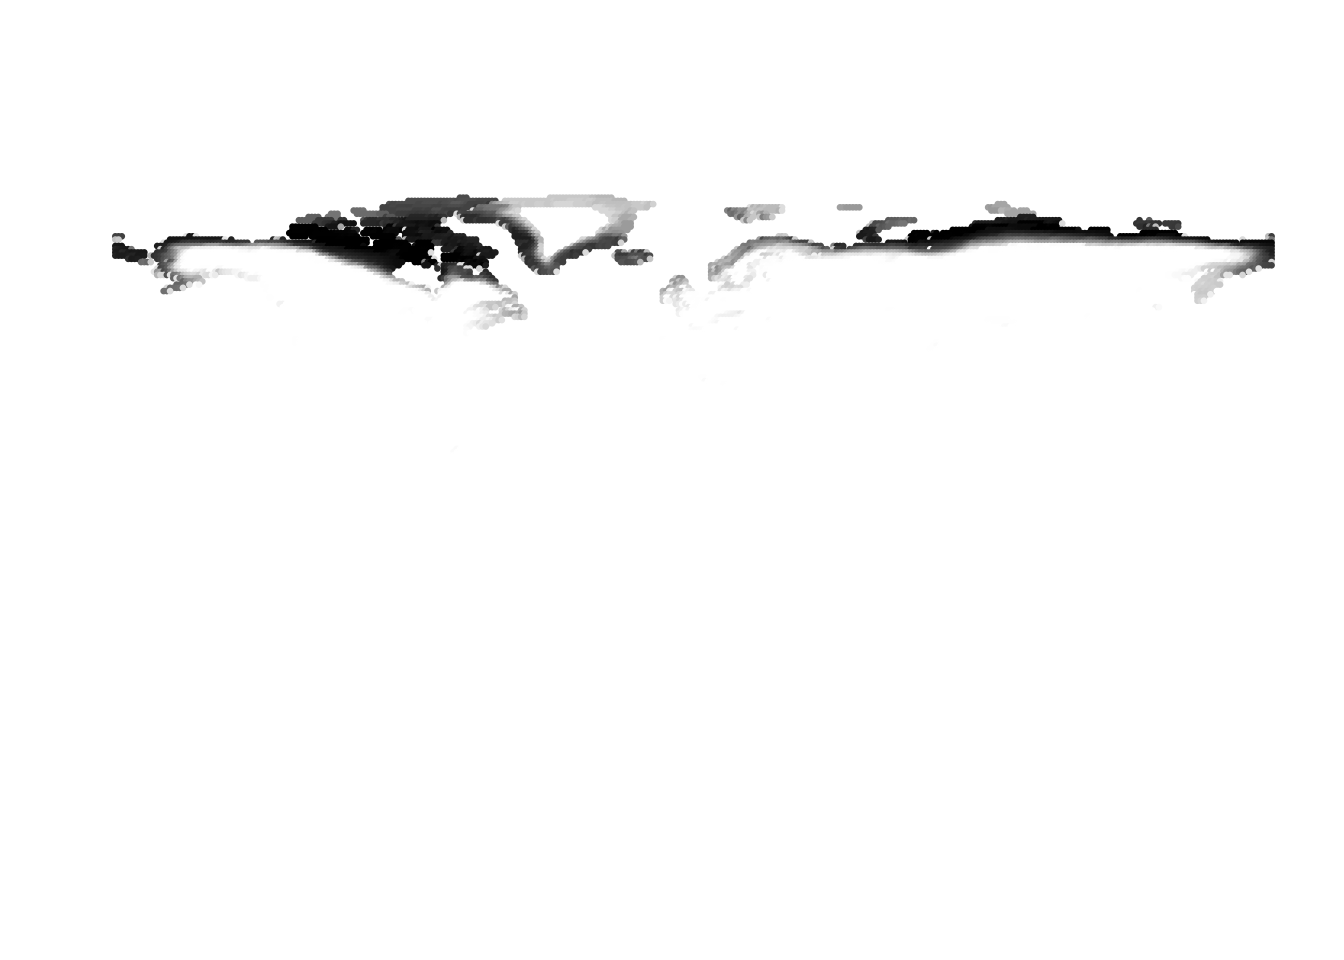


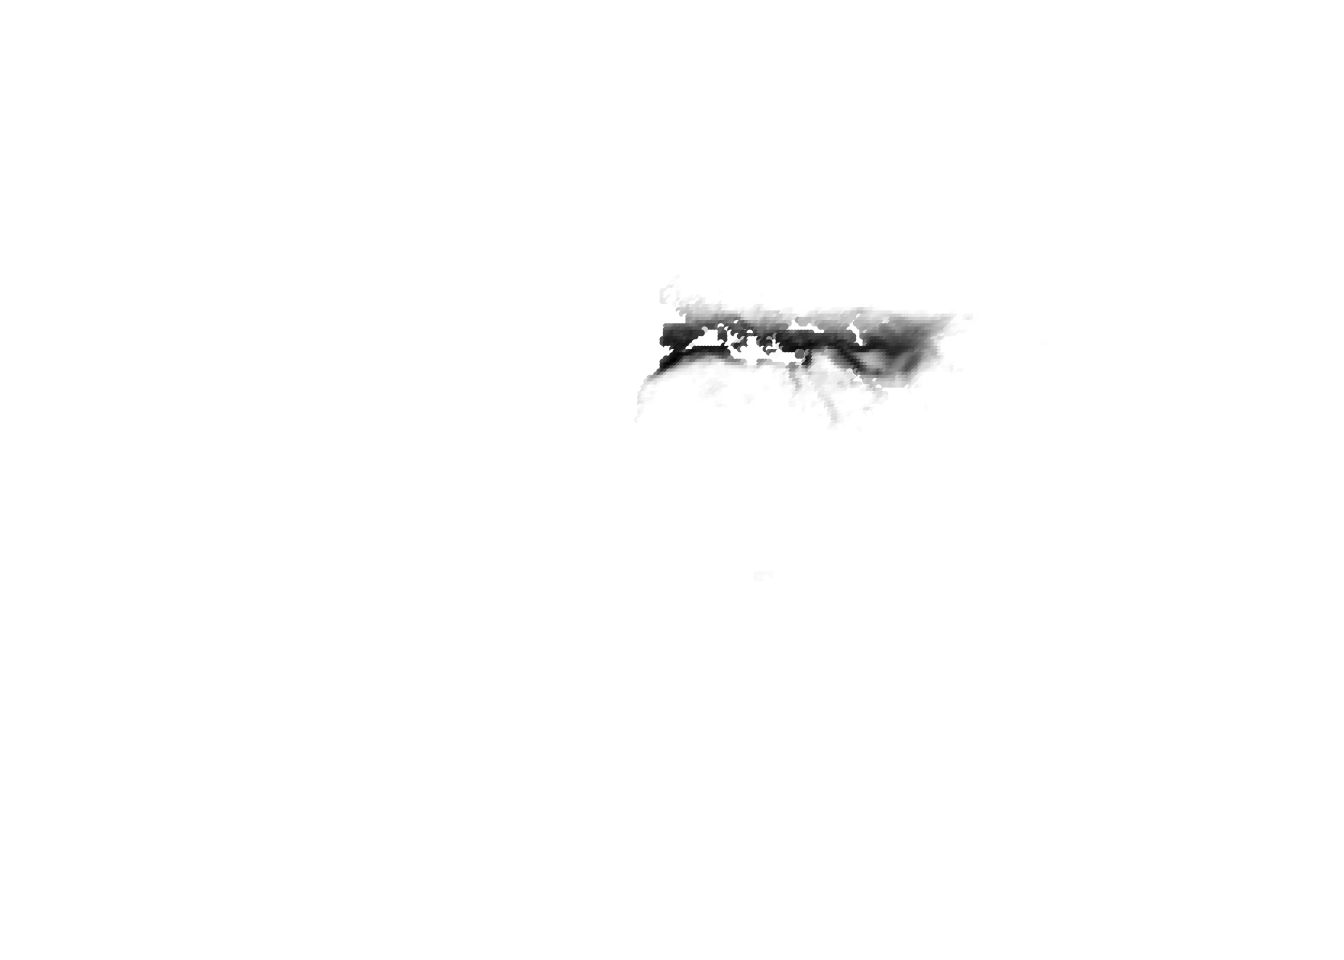


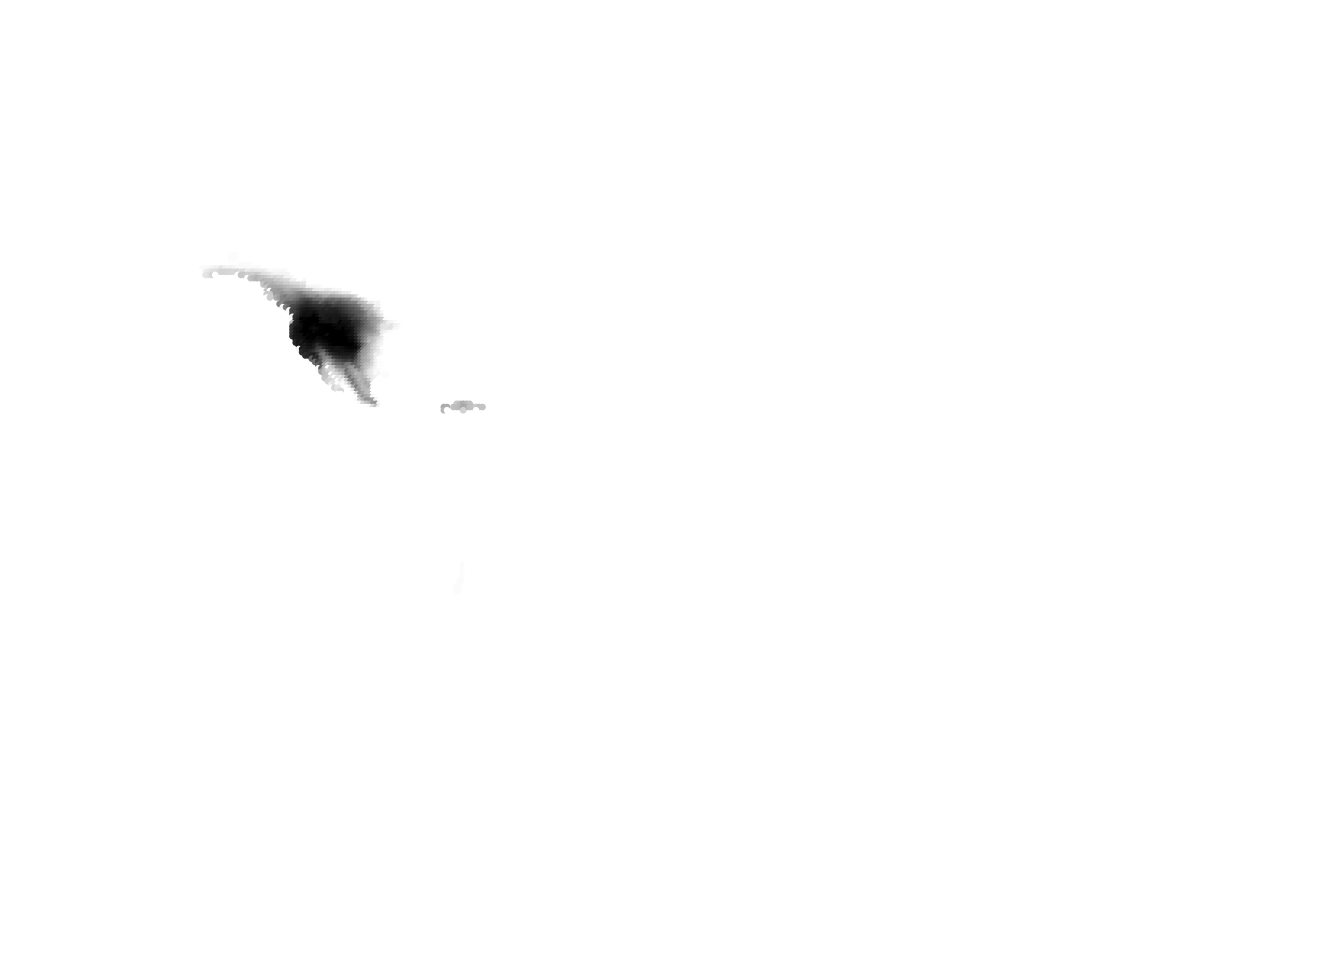


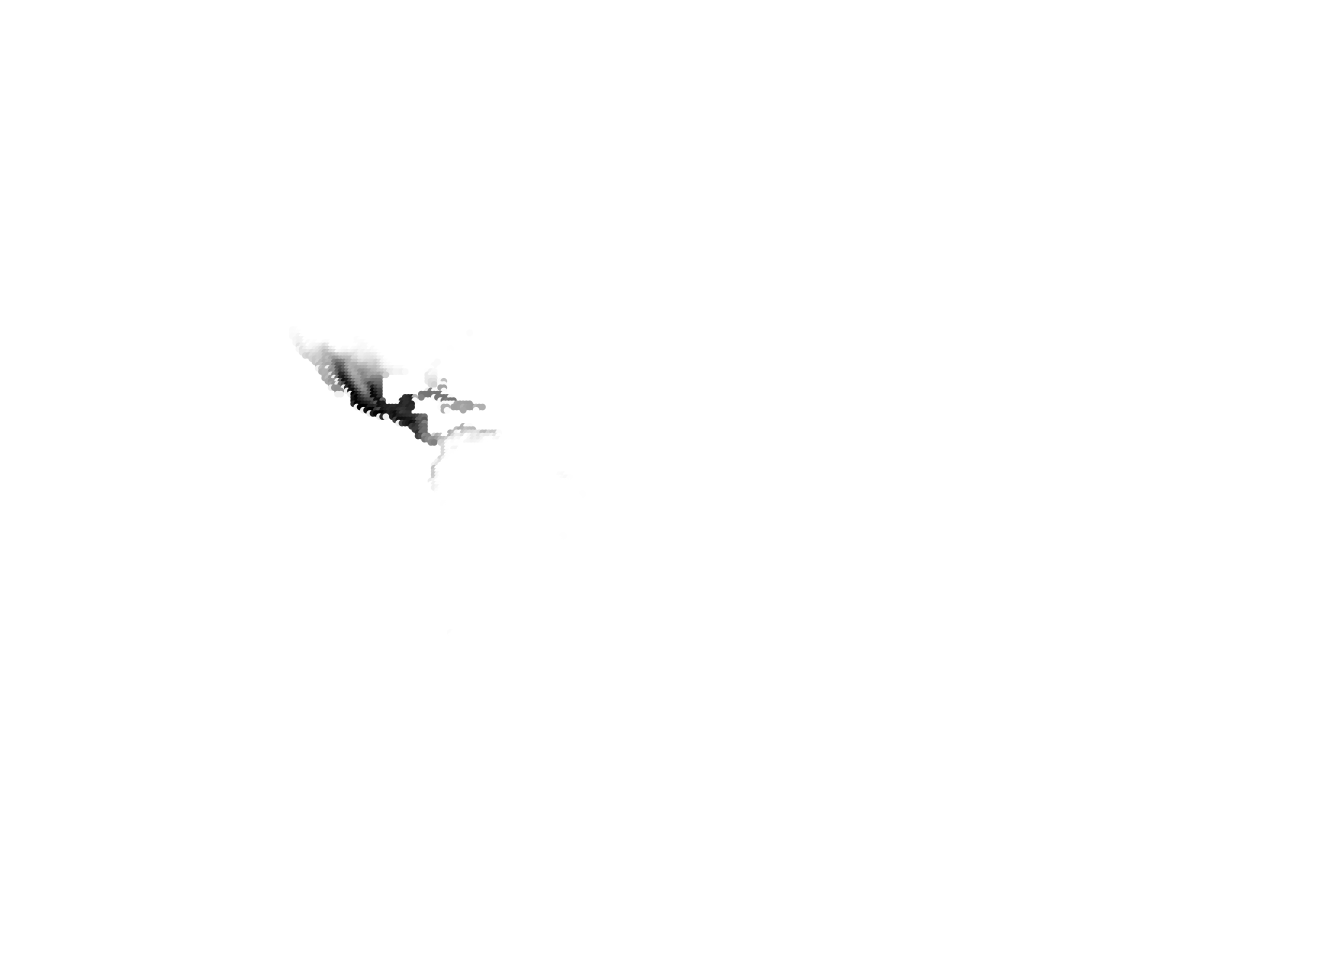


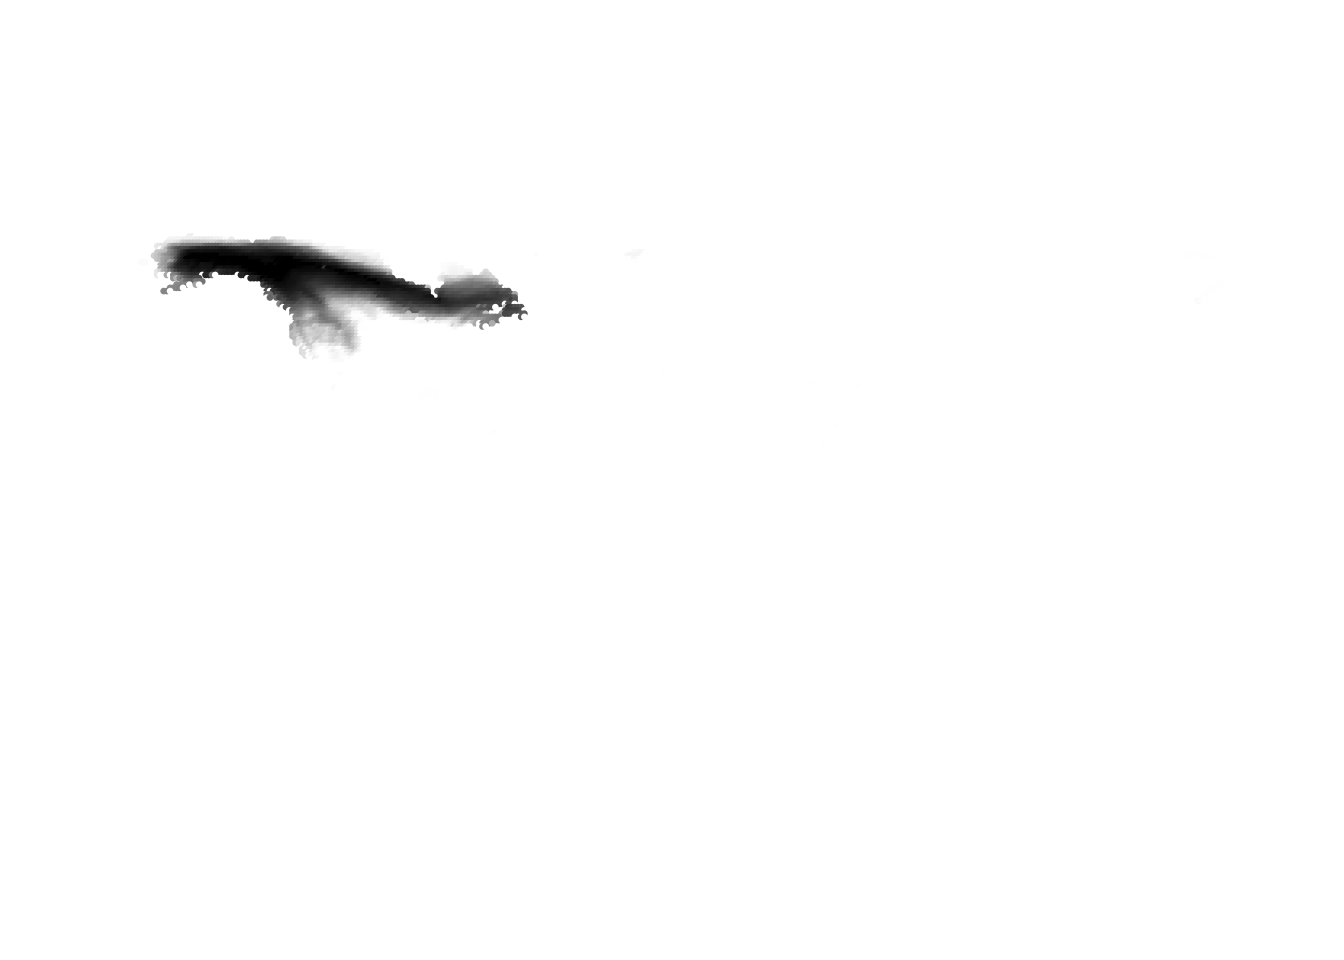
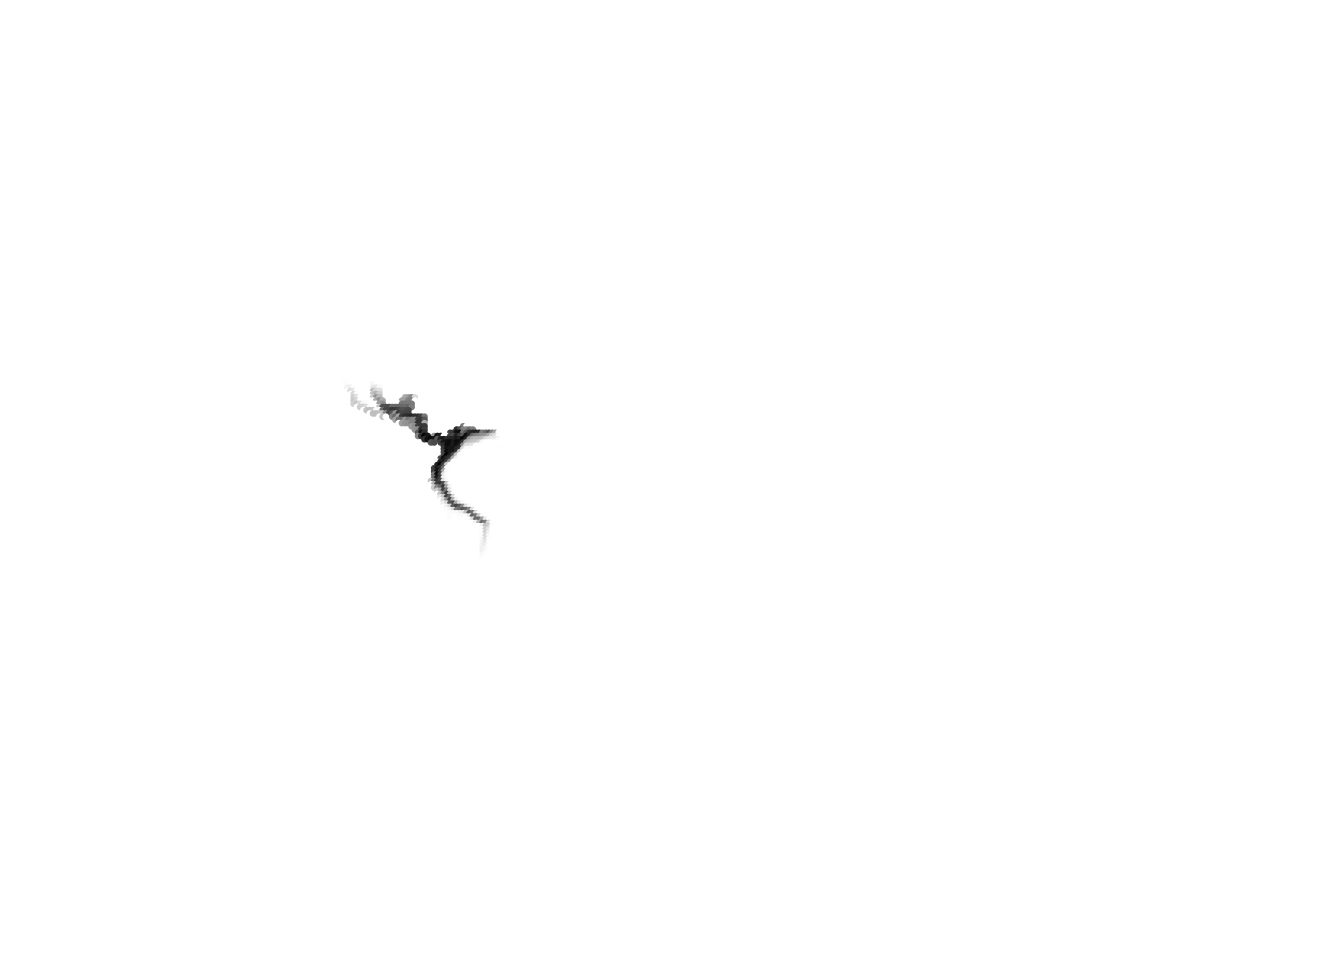
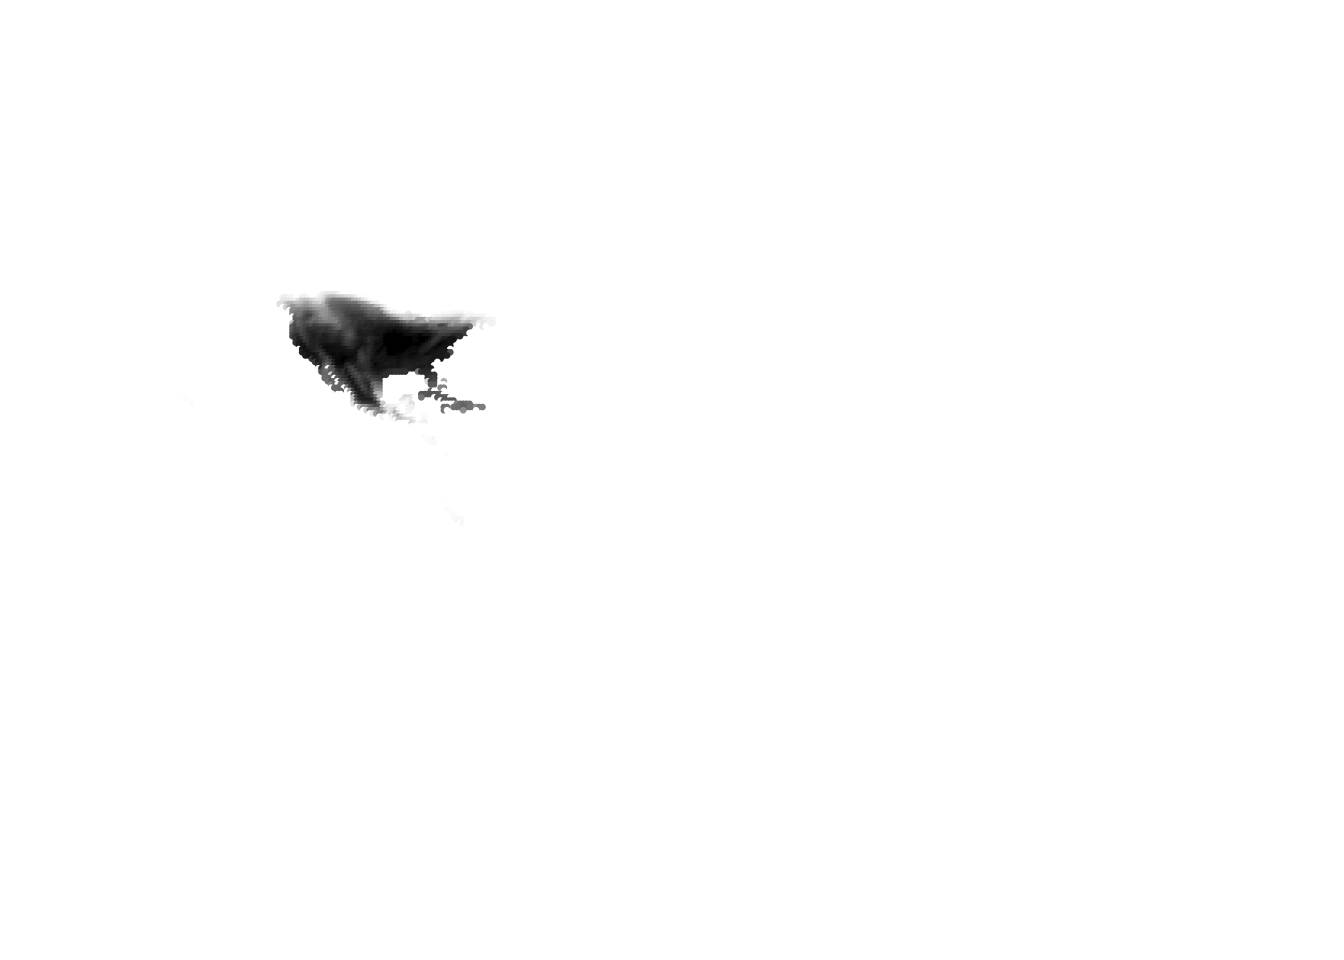
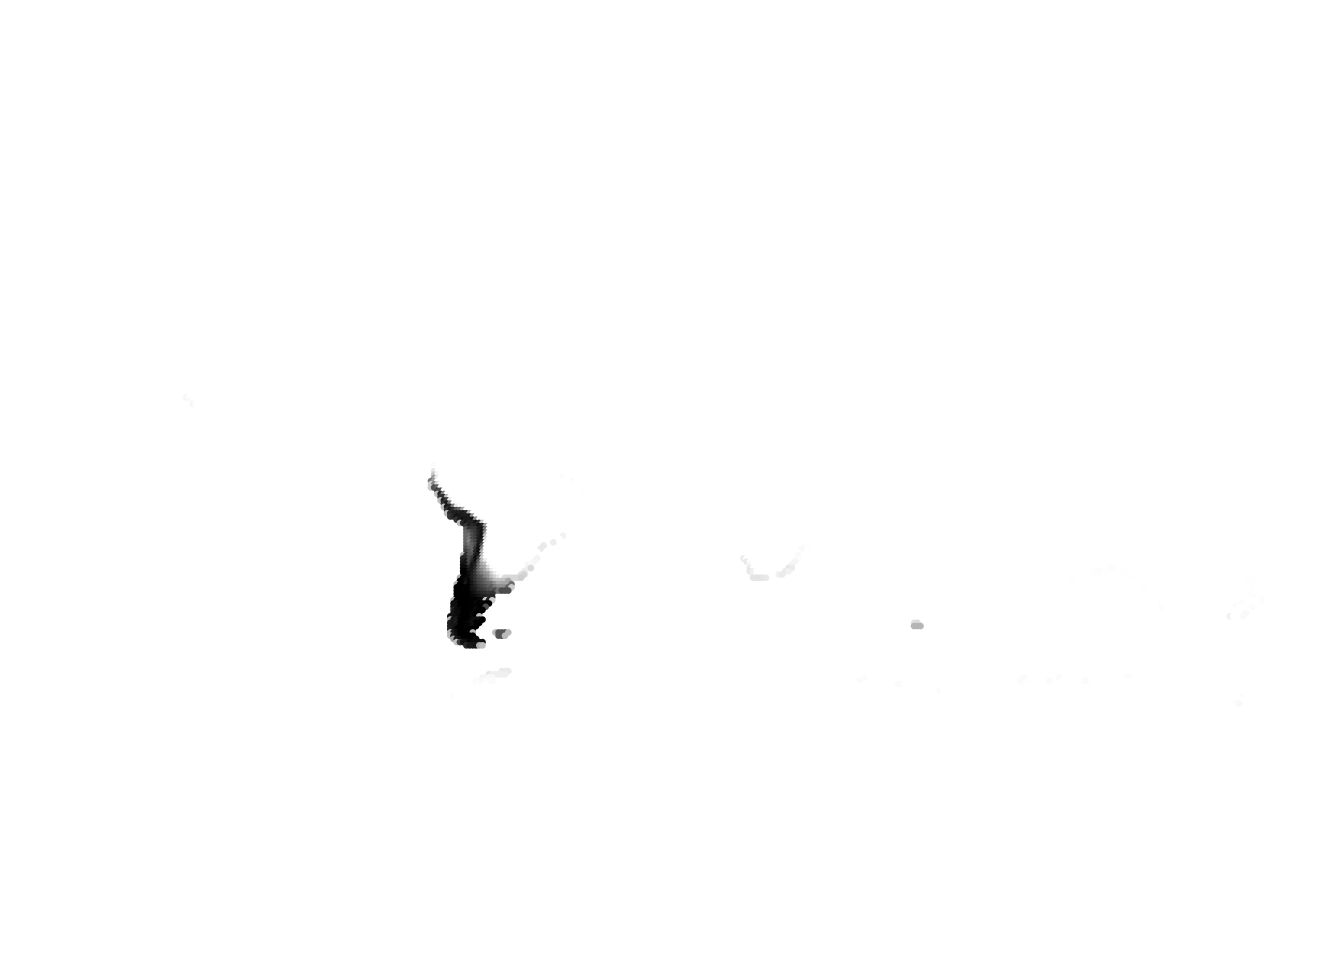
K = 33


This R Markdown site was created with workflowr